Configure Logs Analyzer
Overview
Distributed cloud applications usually generate logs (e.g. states, events) that are frequently used in maintenance and diagnosis of the systems. Inspecting logs has become a norm during production failure. Logs plays a critical role during investigating a production incident of a cloud applications since it is very hard to use a debugging tool in this type of envrionment.
Static dashboards with human-generated thresholds do not scale for modern cloud applications
Logs Analyzer is an AI-powered managed service that surfaces anomalous logs from applications by providing actionable operational insights. It intelligently analyzes the data in near real time using machine learning (ML) and deep learning (DL) models and can detect errors or any anomalous activities in user applications within minutes of their occurrence. This helps to reduce MTTD (mean time to detect).
This topic describes how to setup the AI powered logs analyzers for realtime anomaly detection.
Videos
- Anomaly Detection for Microservices
- Tutorial: Create a Logs Analyzer
Prerequisites
- User must setup a logs service for the same application.
- The logs service must be added to a service group.
To ensure sufficient data for training AI/ML models, we recommend creating the logs analyzer 1-3 days after creating the logs service.
Why?
- Distributed cloud applications can produce large amount (e.g. Terabytes) of logs per day. It is very hard to analyze so much volume of logs manually
- A well-deployed application that operates normally most of the time will produce logs that are normal. Only a small percentage of logs would indicate problems and are hard to pin point.
- Modern cloud applications are changed on a regular (e.g. daily or weekly) basis. It is very hard to keep track of the applications using a static approach
- It is very hard to model seasonality with static alerts. A system with online adaptive learning algorithms is required.
- Downtime is expensive. Having the ability to detect incidents in a timely manner saves enterprises money and reputation
Distributed system architectures increase the need for observability because such architectures can fail due to interaction between multiple systems. -- Gartner
How it Works?
CloudAEye offers both unsupervised and semi-supervised models.
-
In case of unsupervised model, the model learns log patterns from normal execution and can detect an anomaly when the log pattern deviates.
-
In case of semi-supervised model, the model is given small amount of labeled data so that it can learn both normal and abnormal patterns.
Anomaly Score
Our models rank the anomalies detected based on the significance of an anomaly score. An anomaly score usually represents the confidence level of the model about the likelyhood that the detected incident is an anomaly.
CloudAEye uses the following rank categories to communicate the likelyhood of an anomaly:
| Anomaly Score | Confidence Level |
|---|---|
| 0-25 | low |
| 25-50 | medium |
| 50-75 | high |
| 75-100 | very high |
Configure
Create a New Logs Analyzer
From left navigation menu, select Logs Analyzer.
A list of logs analyzer services that are already created will be shown.
The table will be empty if there are no logs analyzer services being created in the system.
To create a new logs analyzer service, click on Create on the top right corner. A new form will appear under Logs-Analyzer > Create.
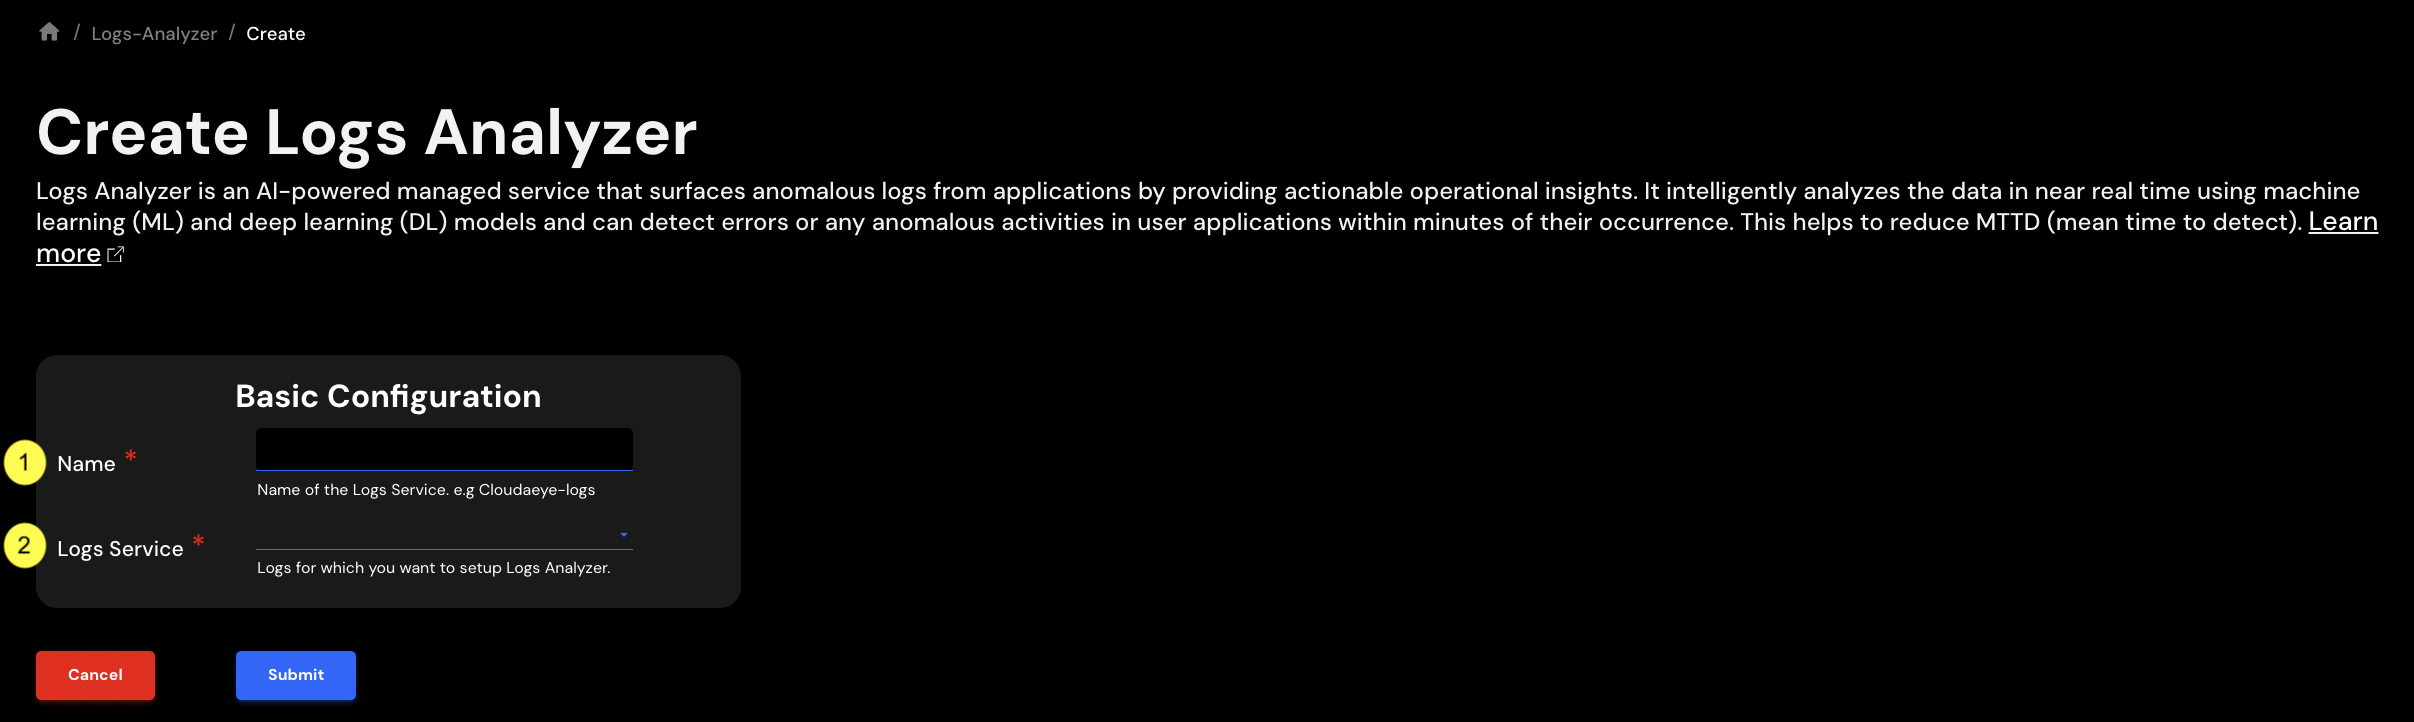
Provide the following informaiton in the form:
- Name: Name of the new logs analyzer service. This is usually an alpha-numeric string. For example, orders-app-logs-analyzer.
- Logs Service: Pick the
Logs Servicethis service will be analyzing from the drop-down. A data pipeline will be created from the logs service. All logs data will then be analyzed by AI models.
Ensure that sufficient data for training AI/ML models is available in the logs service.
Click Submit to create the logs analyzer service.
List All Logs Analyzer(s)
From left navigation menu, select Logs Analyzer.
A list of logs analyzer services that are already created will be shown.
The table will be empty if there are no logs analyzer services being created in the system.
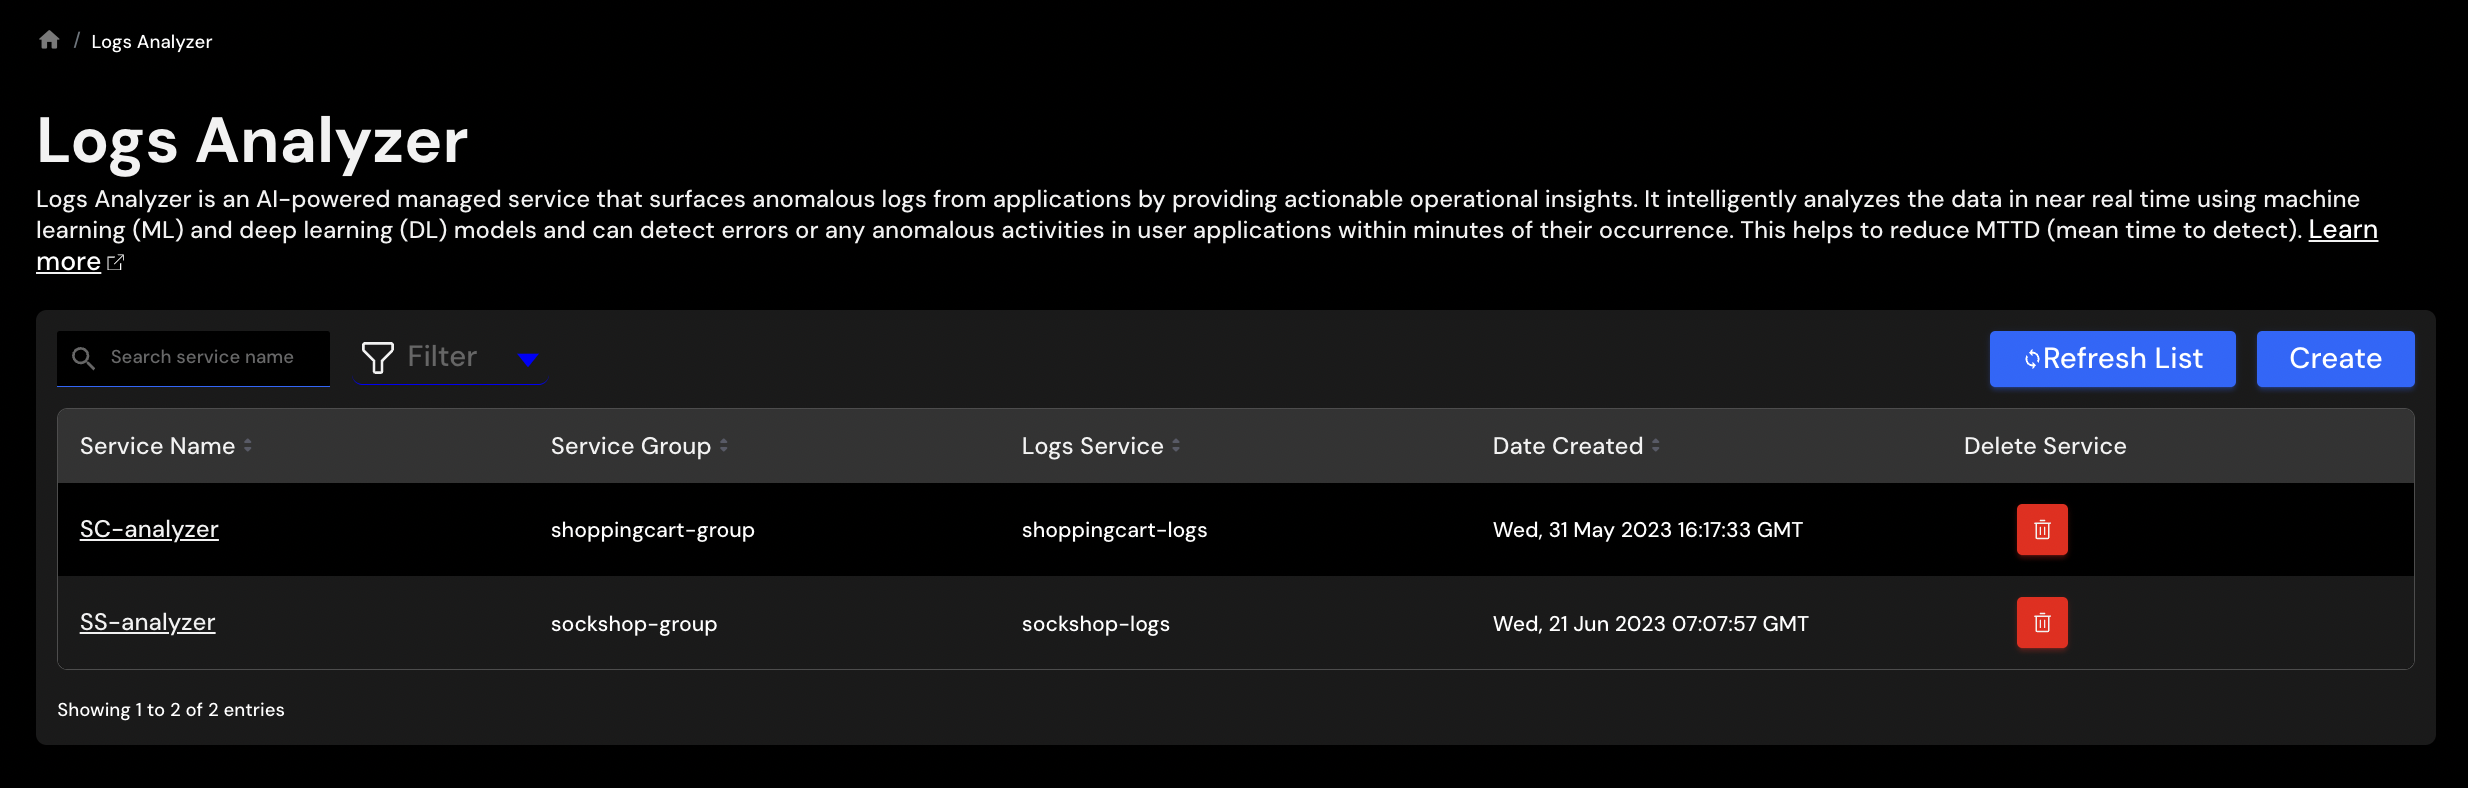
Click on a specific service name link under Service Name column to see details of a Logs Analyzer service.
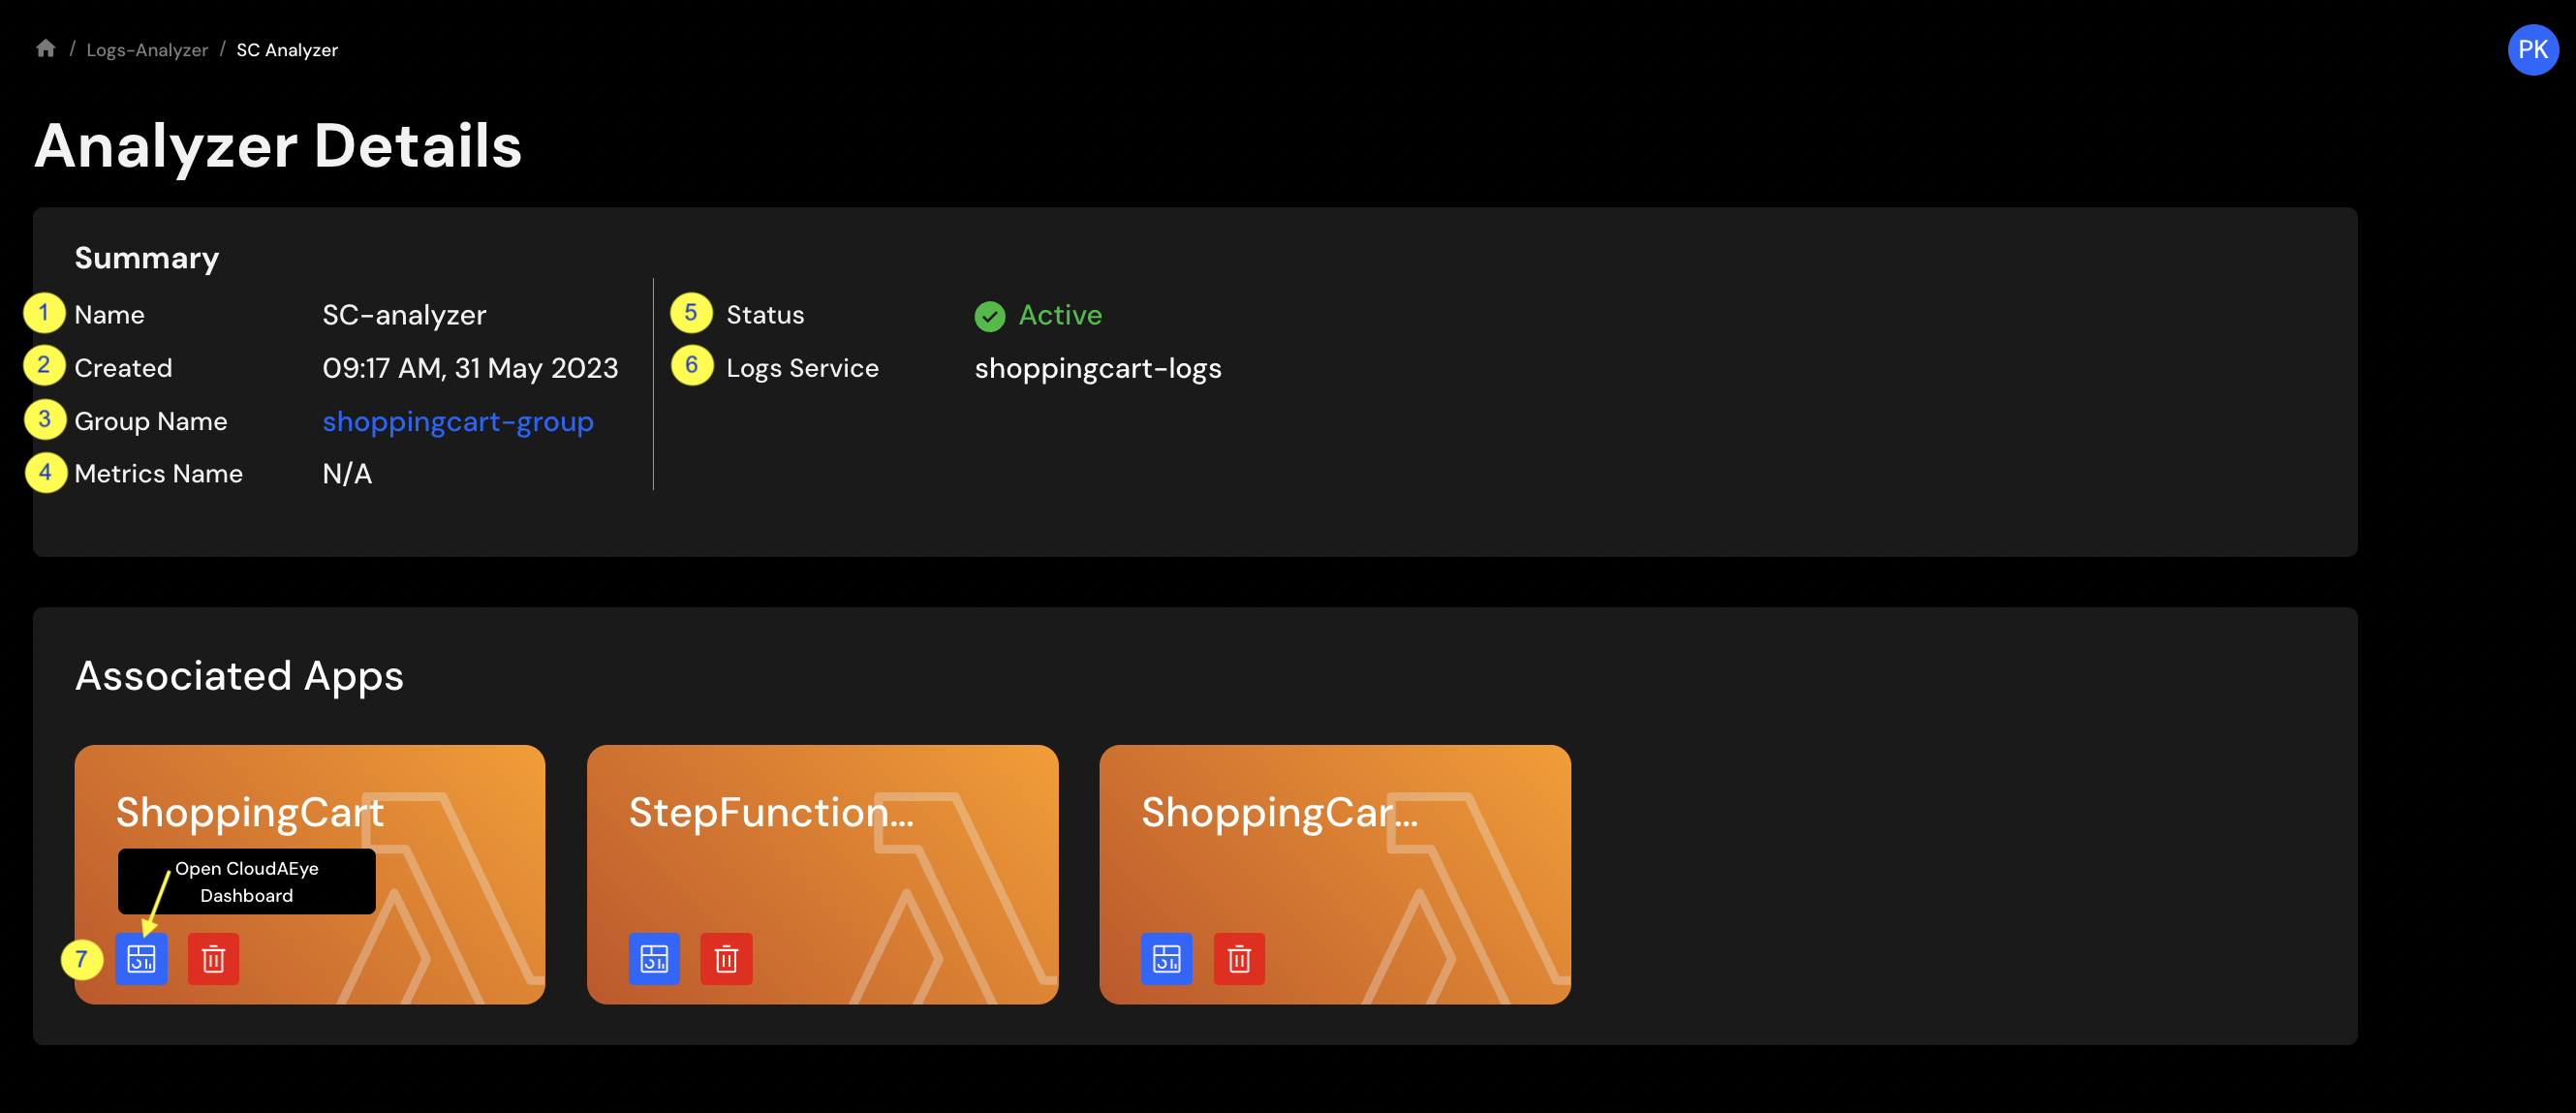
The following information is shown in the details page:
- Name - Name of the logs analyzer service.
- Created - Date when the logs analyzer service was created.
- Group Name - Name of the
Service Groupsthis analyzer is analyzing. - Metrics Name - Metrics services associated with this analyzer.
- Status - Current status of this analyzer.
- Logs Service - Link to the logs service associated with this analyzer.
- Dashboard - Click to see the logs analyzer dashboard. This shows the logs anomalies associated with the logs service.
Delete a Logs Analyzer
From left navigation menu, select Logs Analyzer.
A list of logs analyzer services that are already created will be shown.
The table will be empty if there are no logs analyzer services being created in the system.
Click on Trash button under Delete Service column to delete a specific Logs Analyzer.
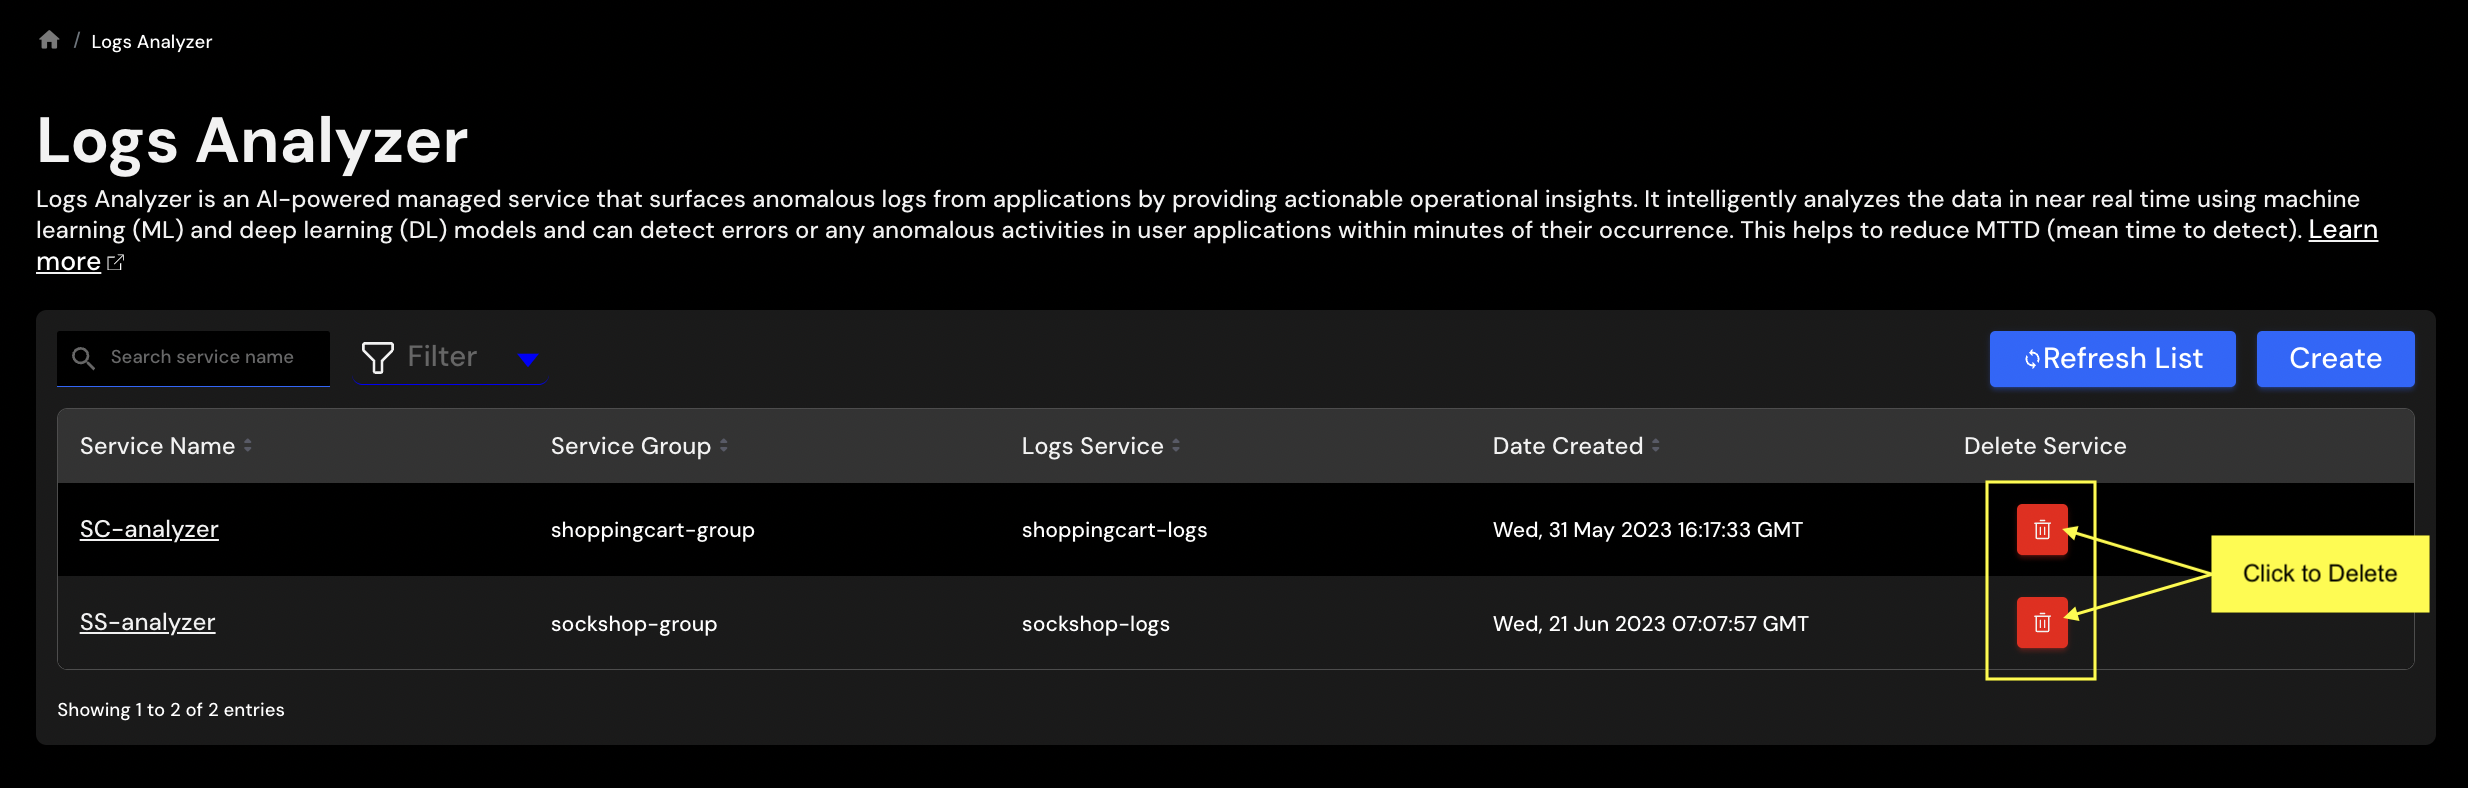
A confirmation windown will be shown.
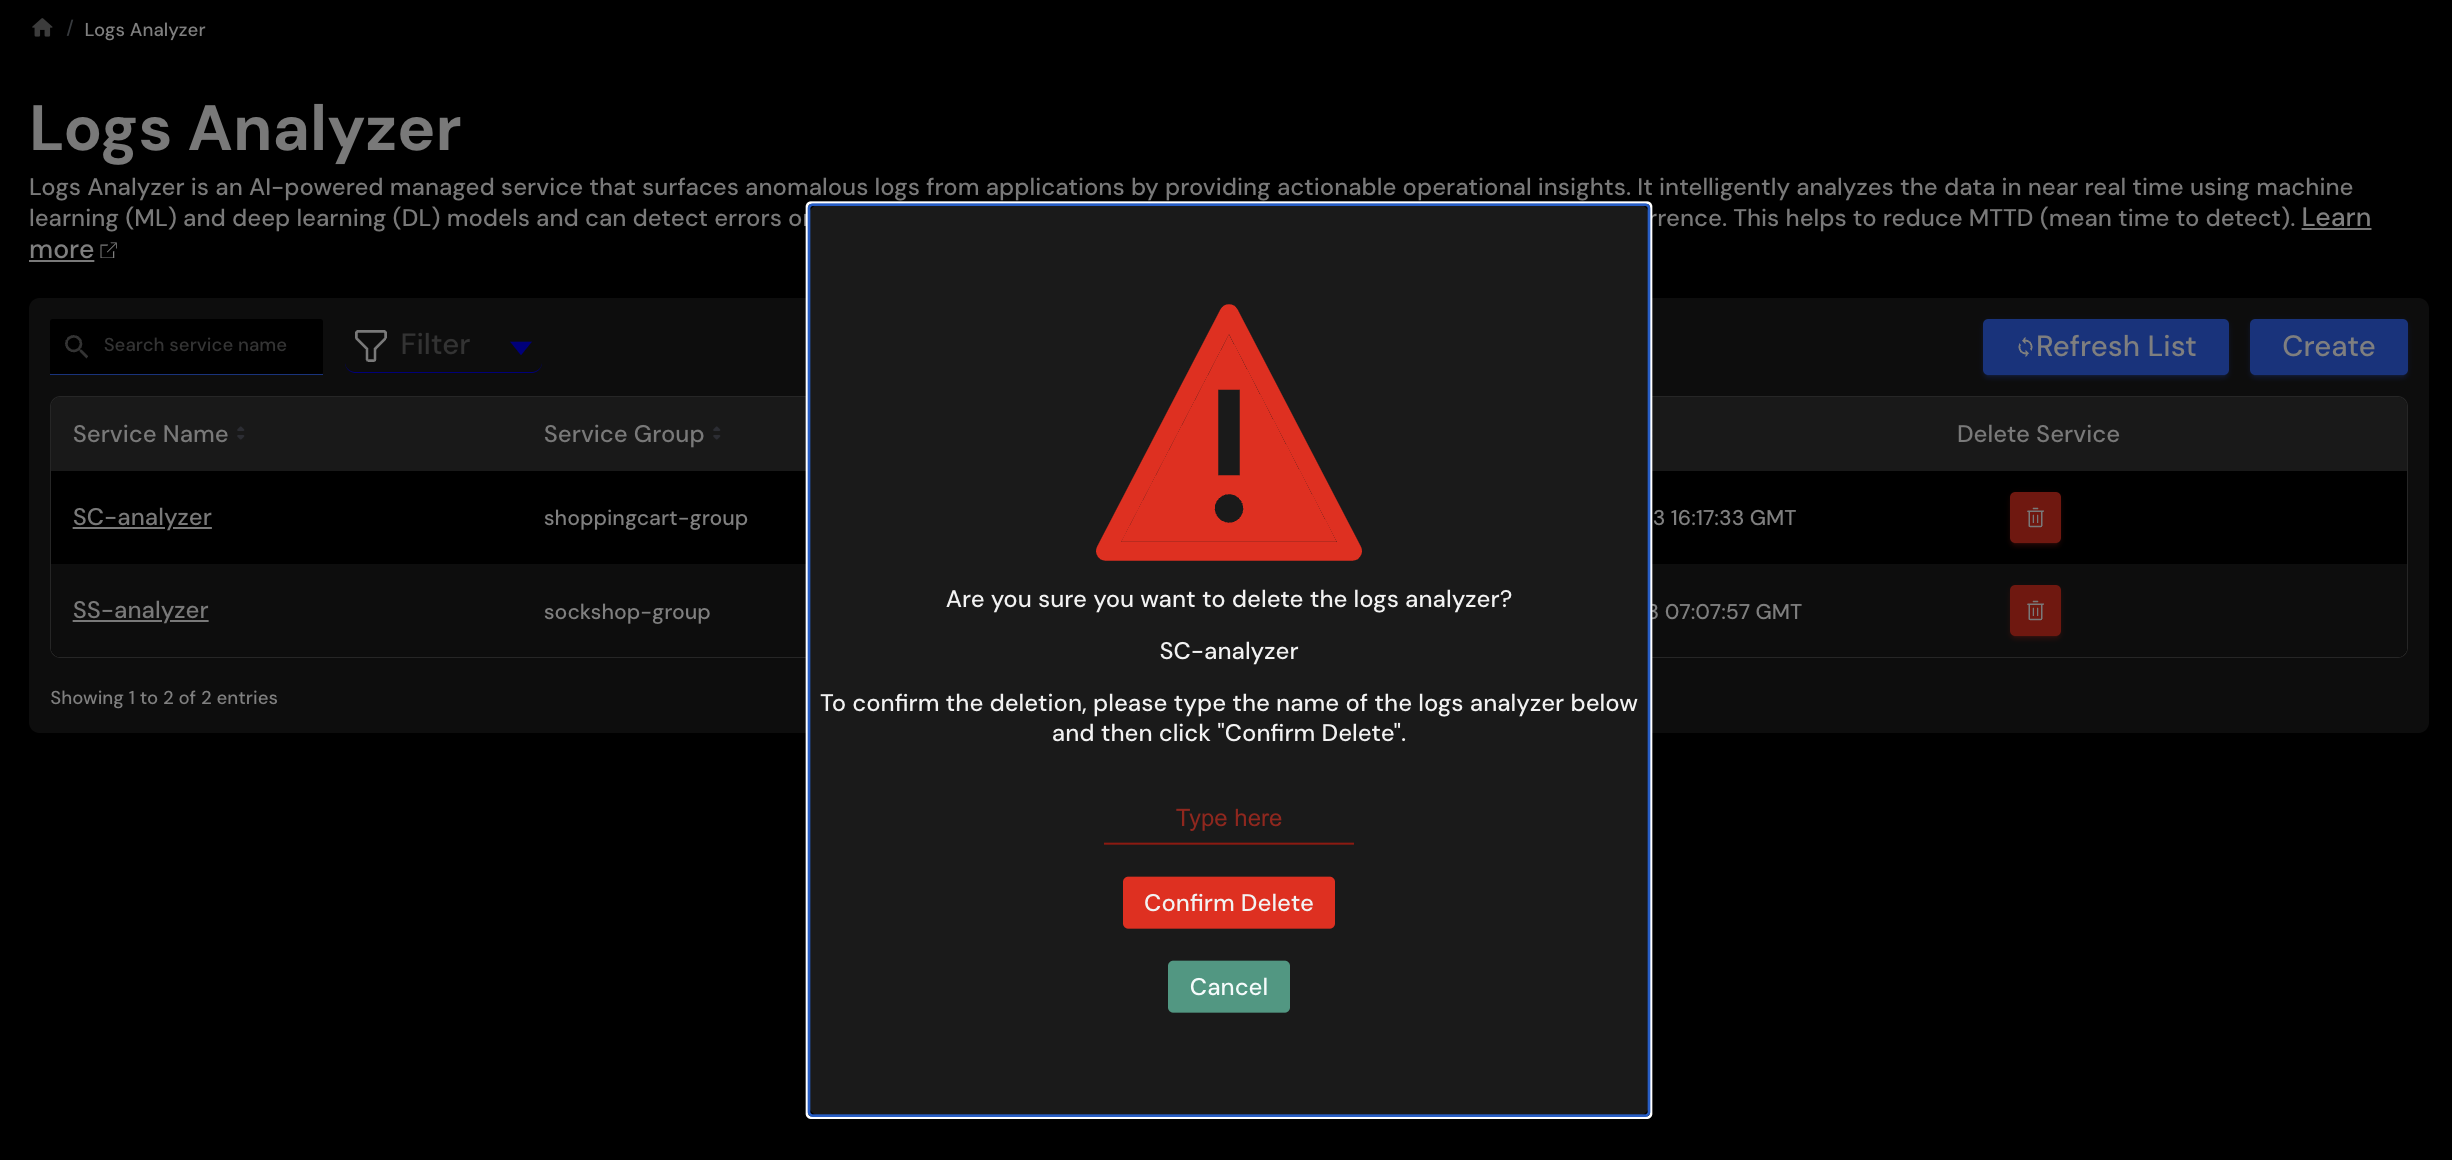
Type the name of the logs analyzer and click Confirm Delete button to delete the Logs Analyzer.