Configuring an Alert
Overview
Setting up and fine-tuning alerts is integral to maintaining a proactive stance towards your system's performance, security, and reliability. Alerts act as an early warning system, allowing you to detect and respond to potential issues before they escalate into significant problems.
By determining specific criteria and thresholds for different events, you can create an automated detection mechanism tailored to your environment. This extends from monitoring simple metrics to complex conditions, such as unauthorized access attempts, unexpected traffic spikes, or resource utilization.
Key features of alert configuration include:
- Customization: Define triggers, severities, and notification channels that align with your unique requirements.
- Integration: Link alerts with various communication platforms like email, Slack, or proprietary systems to ensure prompt notifications.
- Collaboration: Assign alerts to specific team members or groups, enhancing coordinated response efforts and fostering a collaborative approach to issue resolution.
- Analysis: Analyze alert patterns and trends over time to make data-driven decisions and continually enhance your system's stability and performance.
The subsequent sections of this guide will walk you through the detailed process of configuring an alert, equipping you with the tools and knowledge to establish effective and responsive monitoring strategies.
Remember, appropriate and timely alerts form the cornerstone of a secure, high-functioning infrastructure, allowing you to anticipate and act, rather than react.
Getting Started
Creating a new alert is a simple and intuitive process that you can initiate directly from the Alerts page. Here's a step-by-step guide to walk you through:
Step 1: Access the Alerts Page
Navigate to the Alerts page, where you will find the Create Alert button.
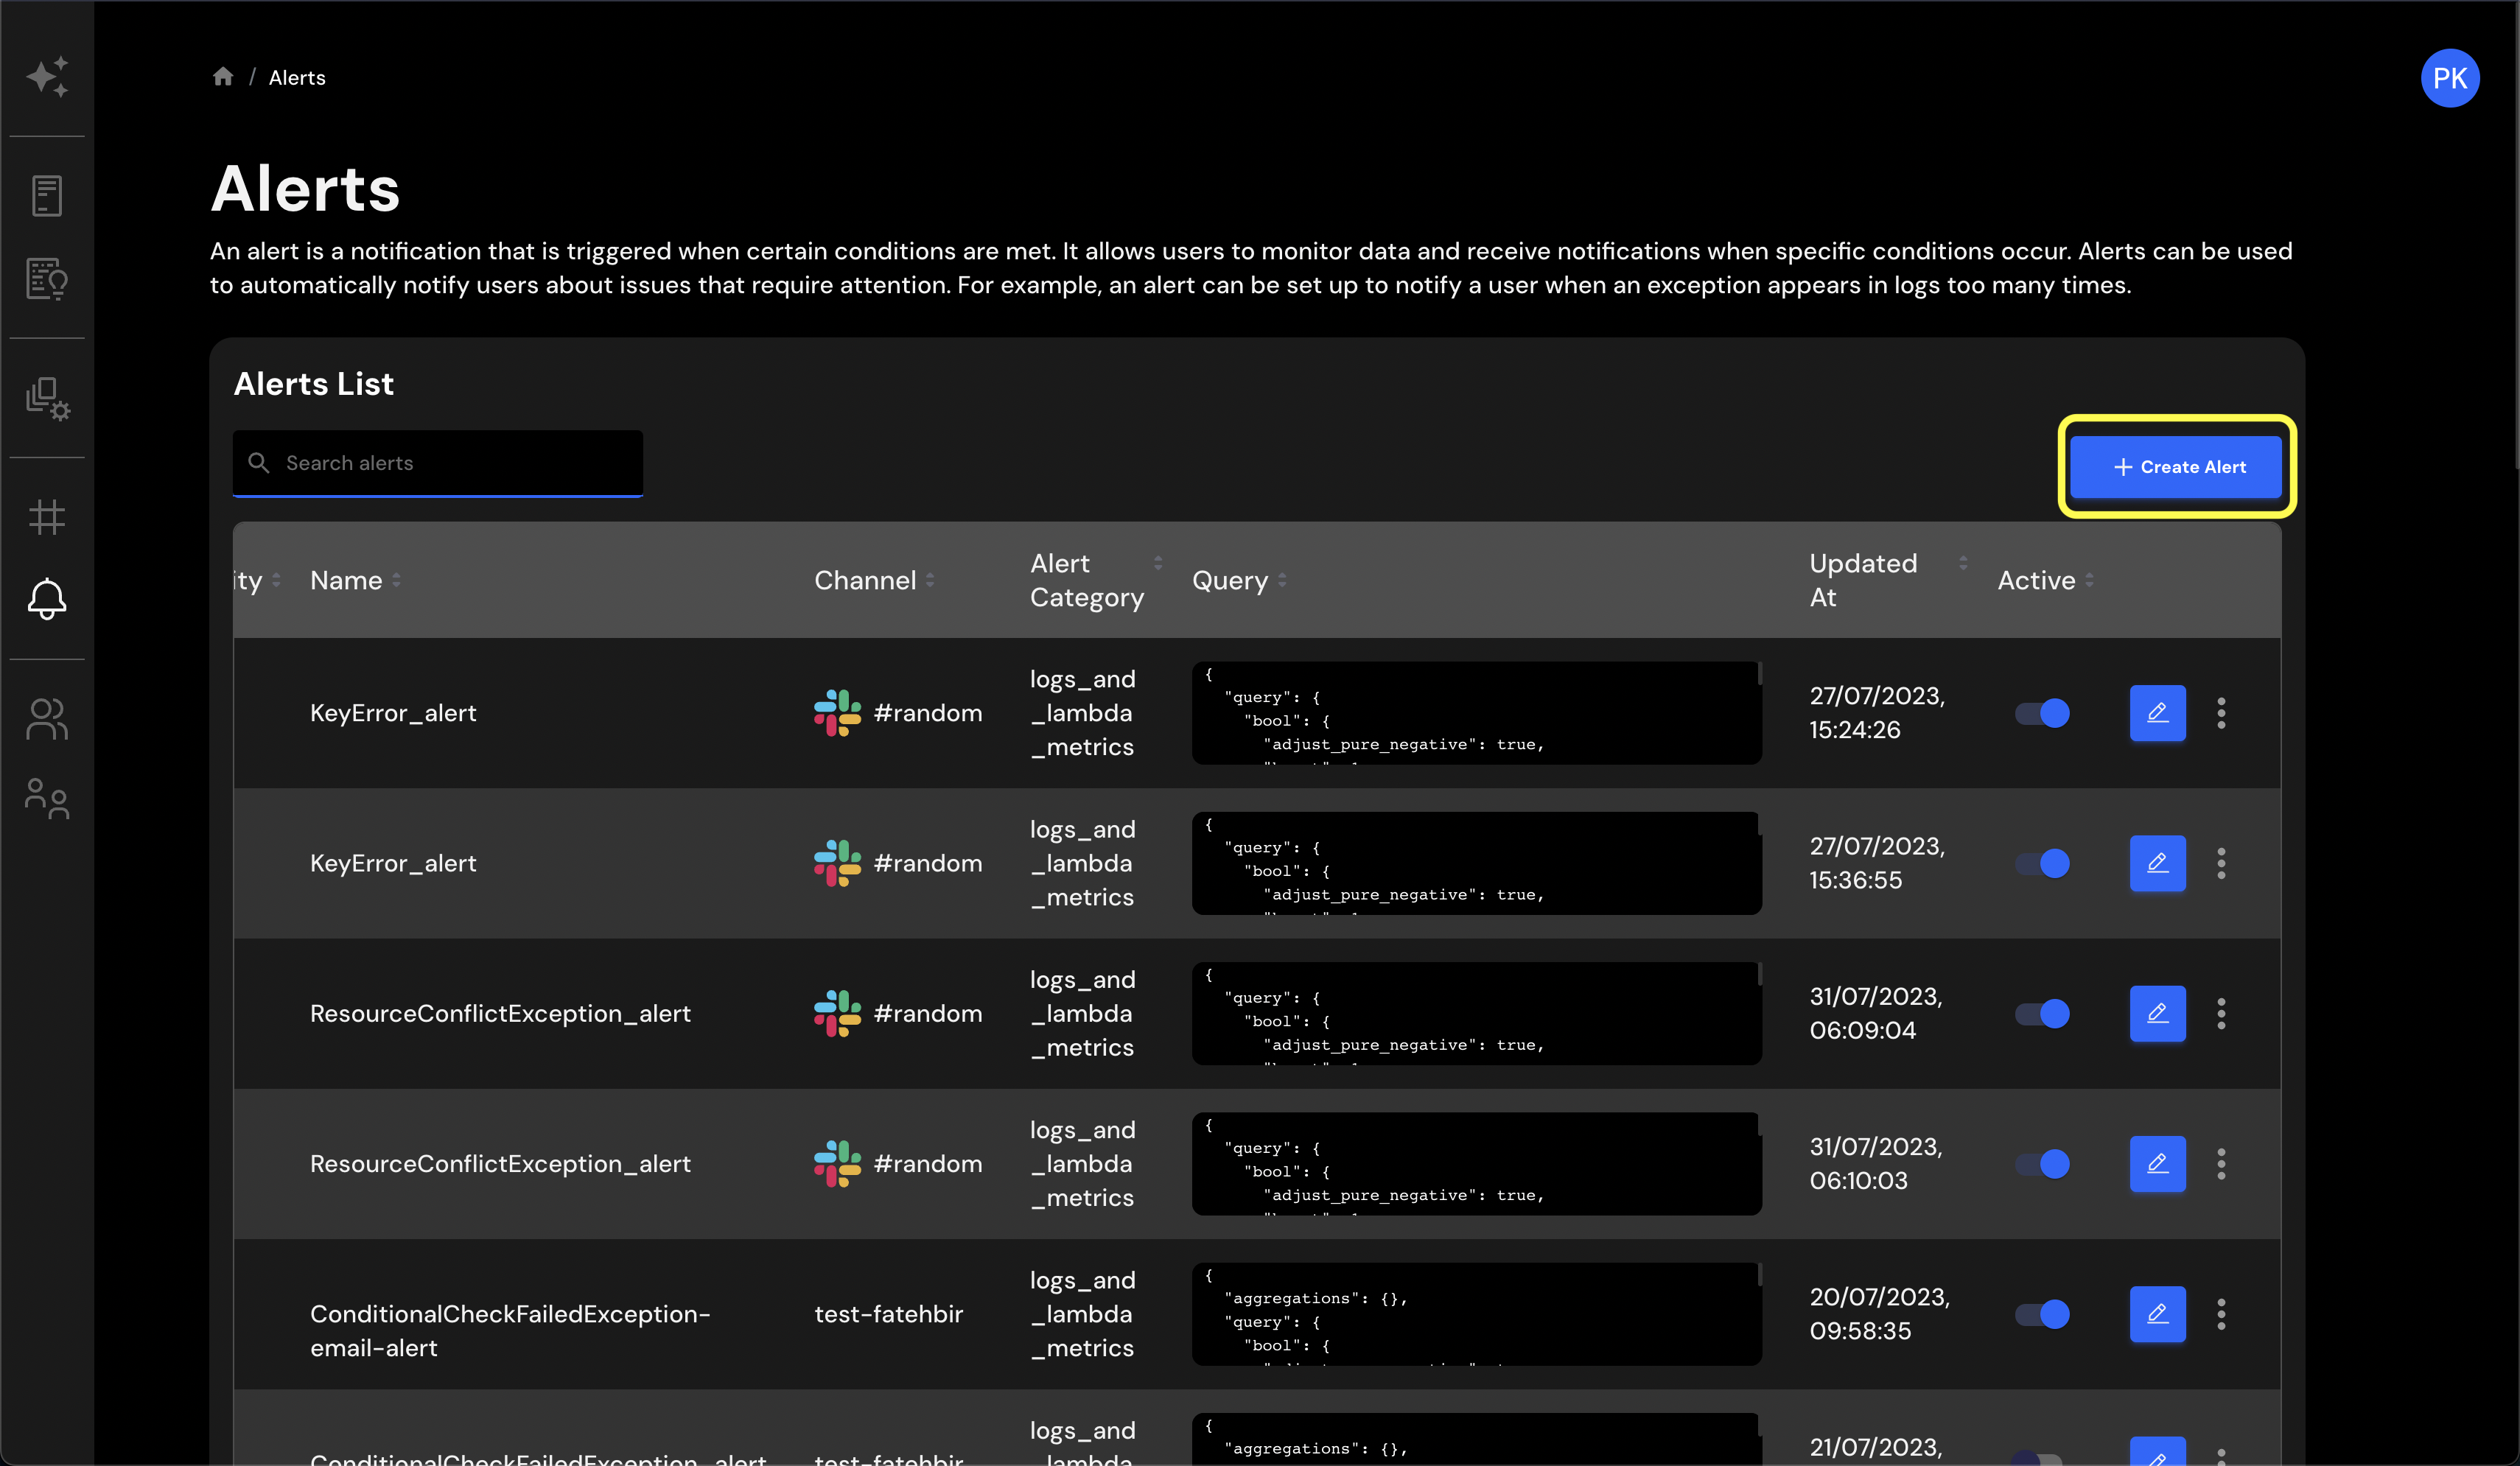
Step 2: Open the Create Alert Page
Click on the Create Alert button, and you'll be taken to the Create Alert page, showcasing the layout and fields necessary to set up an alert.
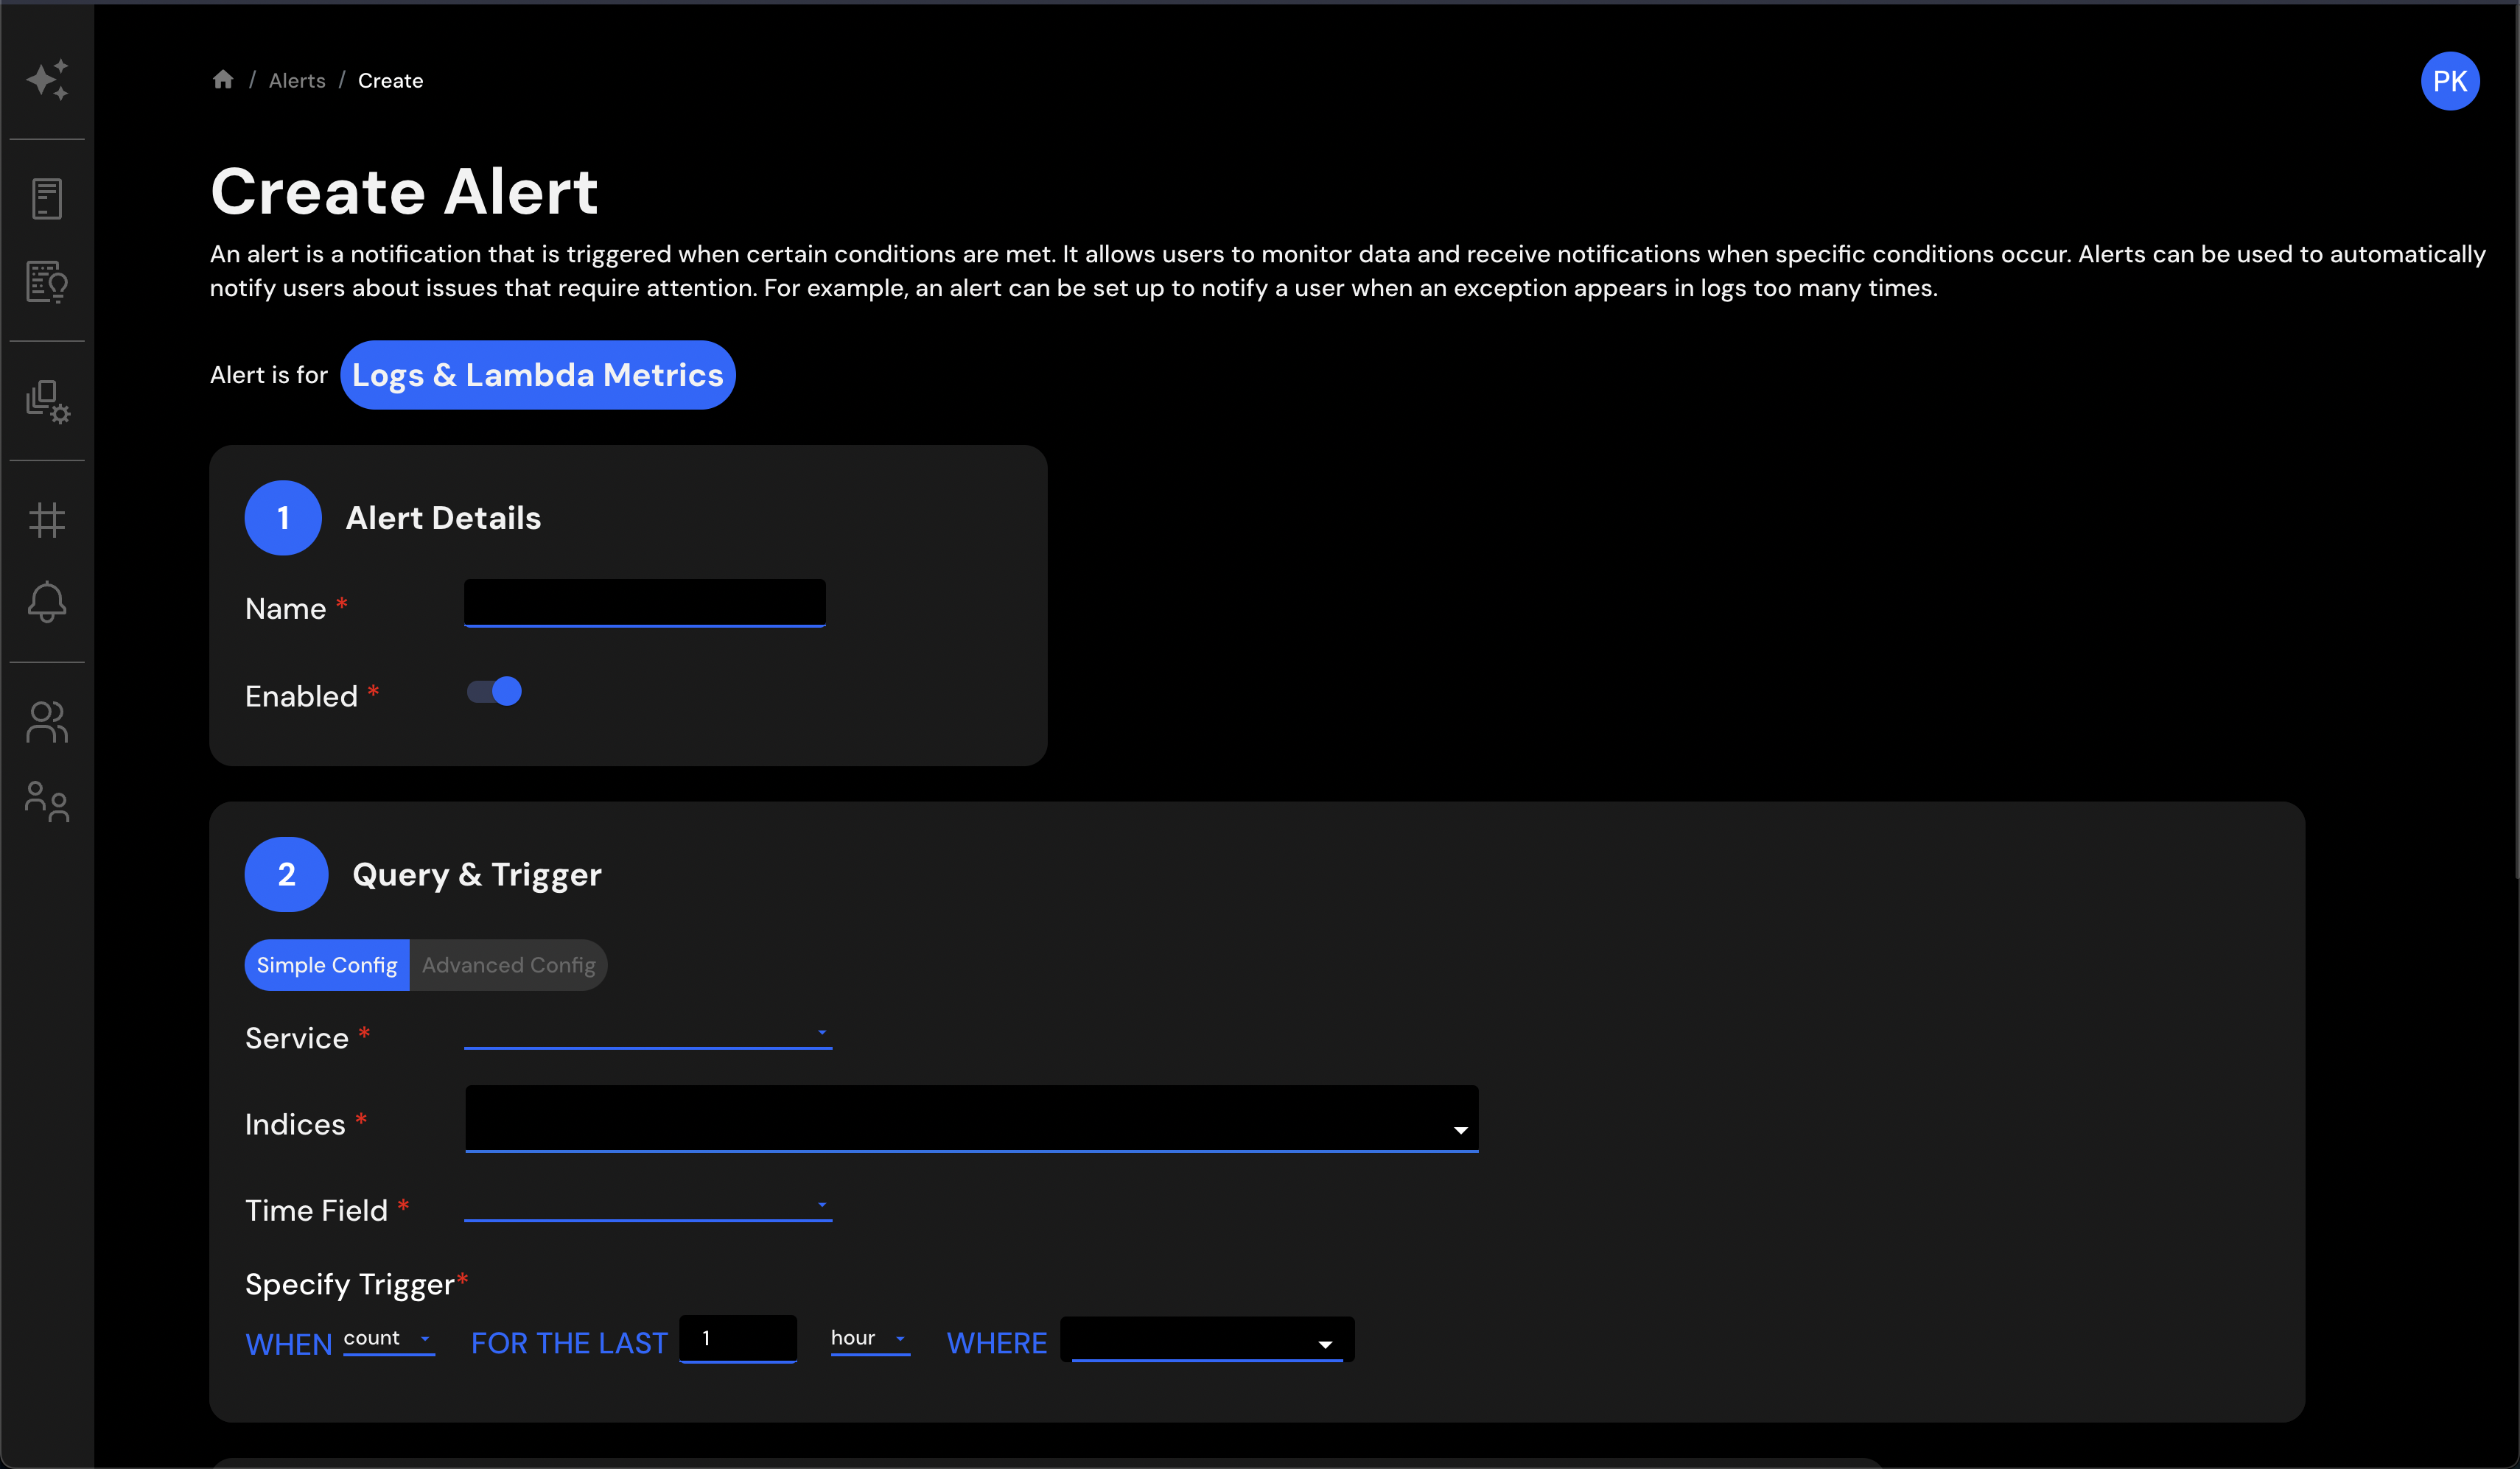
Step 3: Understand the Create Alert Page
The Create Alert page is thoughtfully designed and composed of different sections, numbered 1-4. Understanding these sections will empower you to tailor alerts to your specific needs. Below, we'll discuss each section one by one:
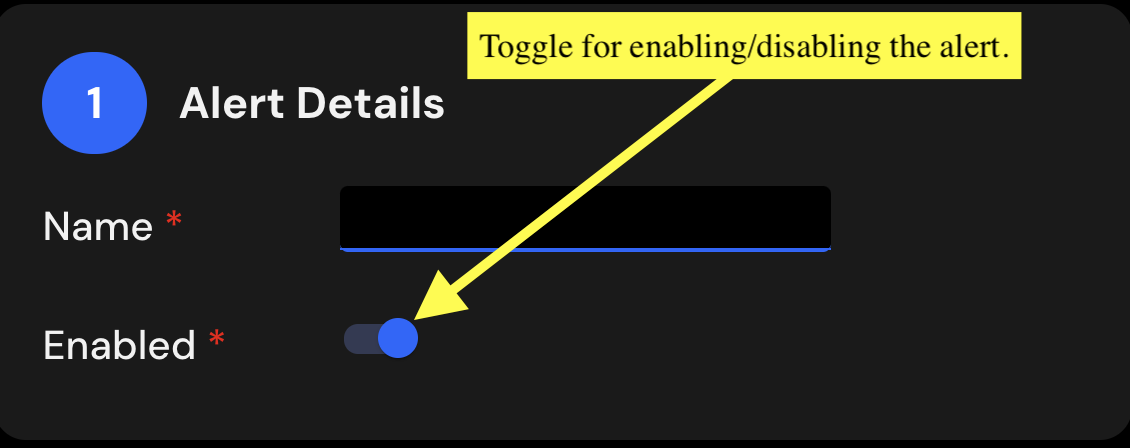
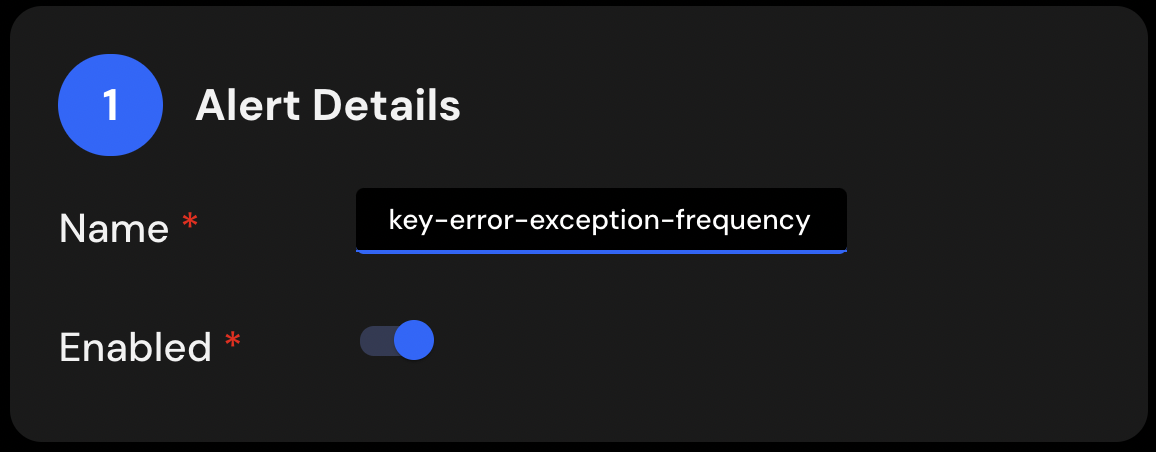
1. Alert Details
In this section, you can provide a descriptive name for the alert being configured and choose whether it should be active upon creation.
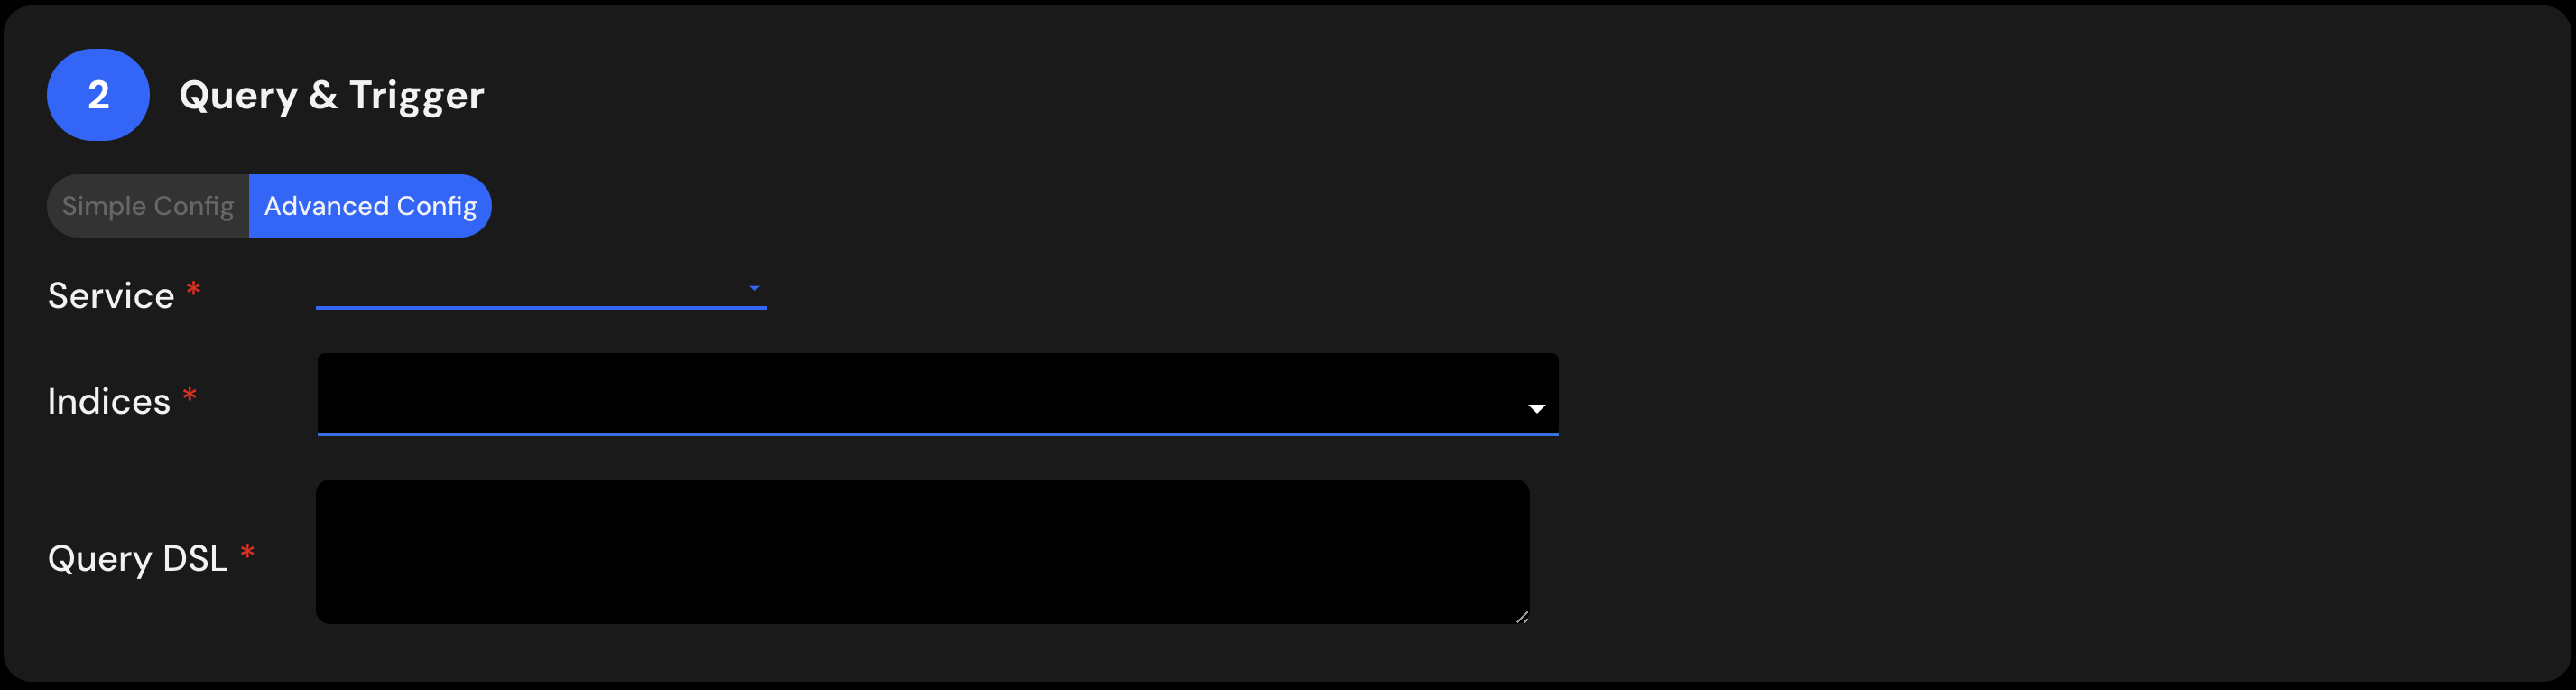
2. Query and Trigger
This section is where you define the conditions for your alert. You construct a query which will be processed at set intervals, and a trigger which will fire once the query condition is met.
There are two ways to configure the Query & Trigger:
- Simple Config:
This option is ideal for those unfamiliar with Query DSL, or for configuring a straightforward alert.
- Advanced Config:
This option allows you to write the query using Query DSL, providing more flexibility and specificity in your alert configuration.
For a comprehensive understanding of how to define queries and triggers, especially if you're new to Elasticsearch queries or want to explore advanced configurations, please refer to our Query & Trigger Configuration Guide page.
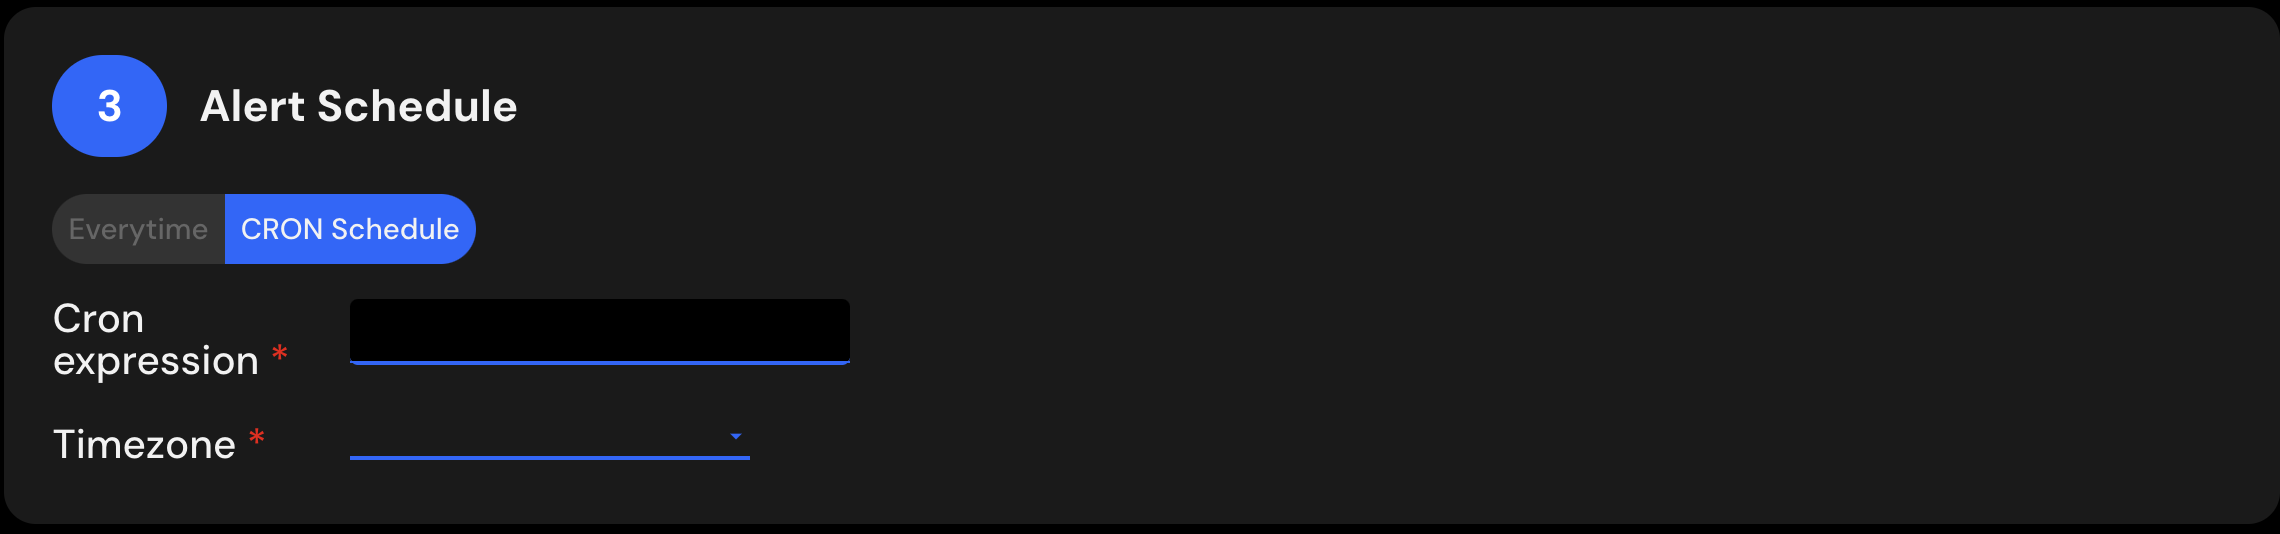
3. Alert Schedule
Here you specify the frequency at which the query should run. You can use a cron expression for precise scheduling, or select the Everytime option, which will run the query at 15-minute intervals.
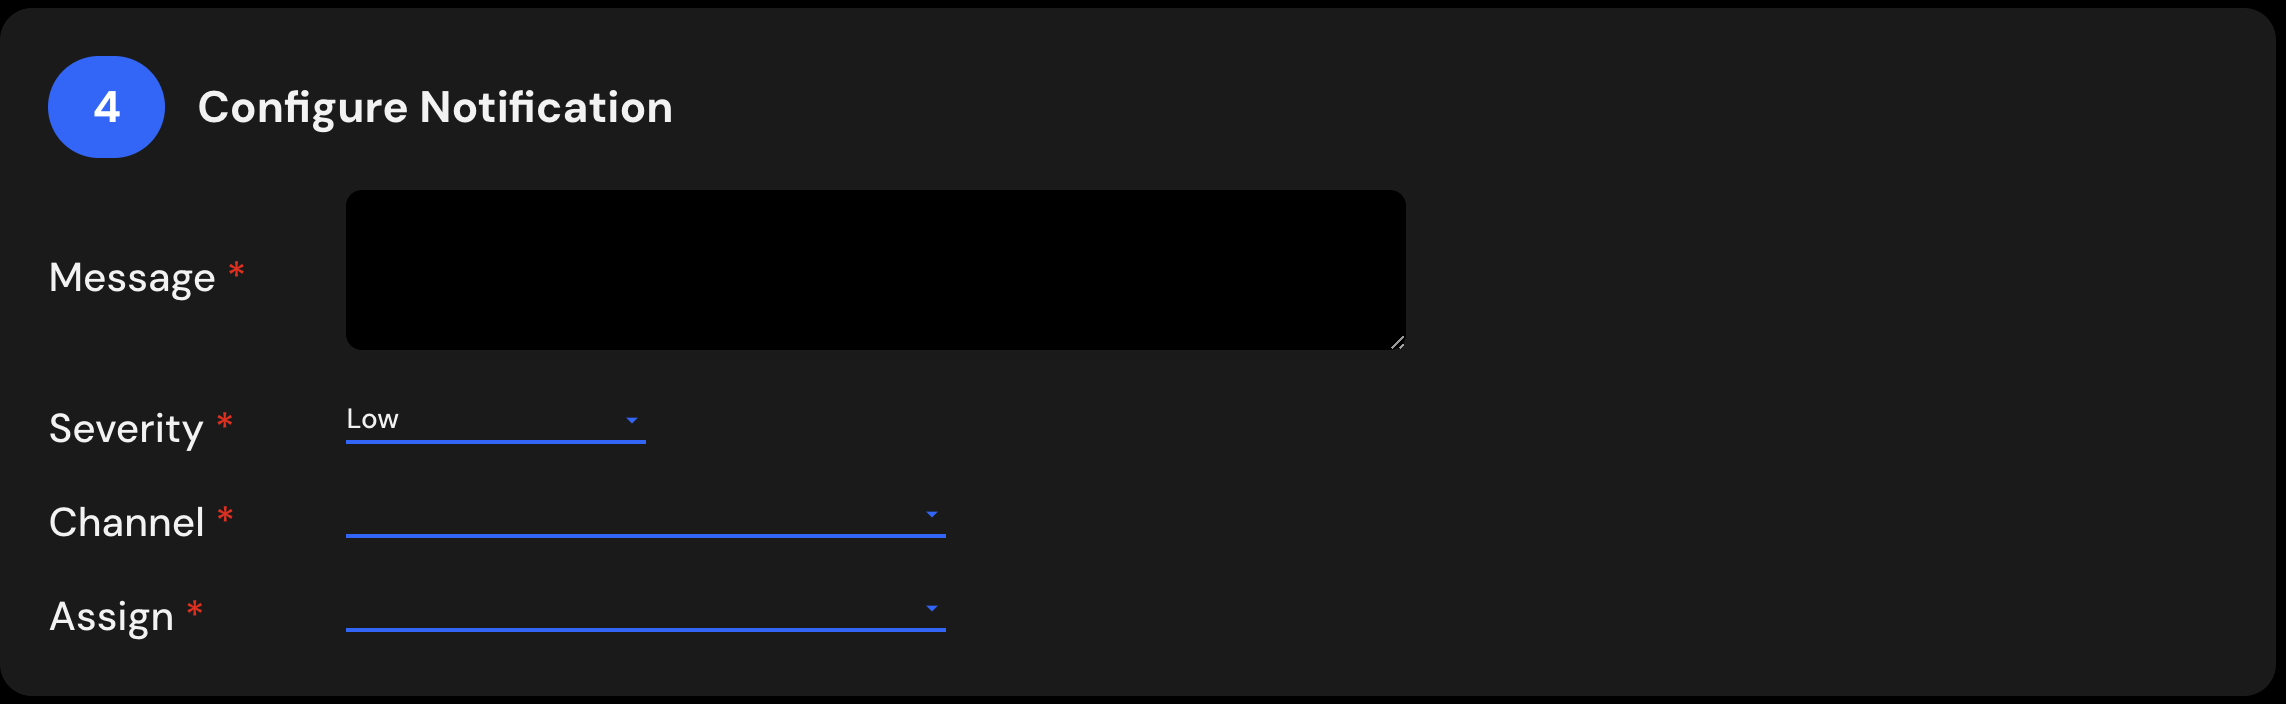
4. Configure Notification
The final section allows you to specify:
- The message you want to recieve once the alert is triggered
- The level of importance
- Which notification channel the alert should be sent to
- An assignee responsible for monitoring or handling this alert
By following these steps, you'll be able to set up alerts that enhance your system's responsiveness and oversight. Take time to explore each section, knowing that these alerts will serve as key components in maintaining your system's integrity and security.
Example Walkthrough
In this walkthrough, we'll set up an alert to trigger when the occurrence of the Key Error exception in our logs exceeds a specific frequency. To learn more about how these exceptions are caught and monitored, visit the Log Insights page.
First, navigate to the Alerts page and click on the Create Alert button. You can find the details here.
Step 1: Filling out the Alert Details
Keep the name of the alert both concise and descriptive. In this case, as we're monitoring the frequency of the exception, a suitable alert name would be key-error-exception-frequency.
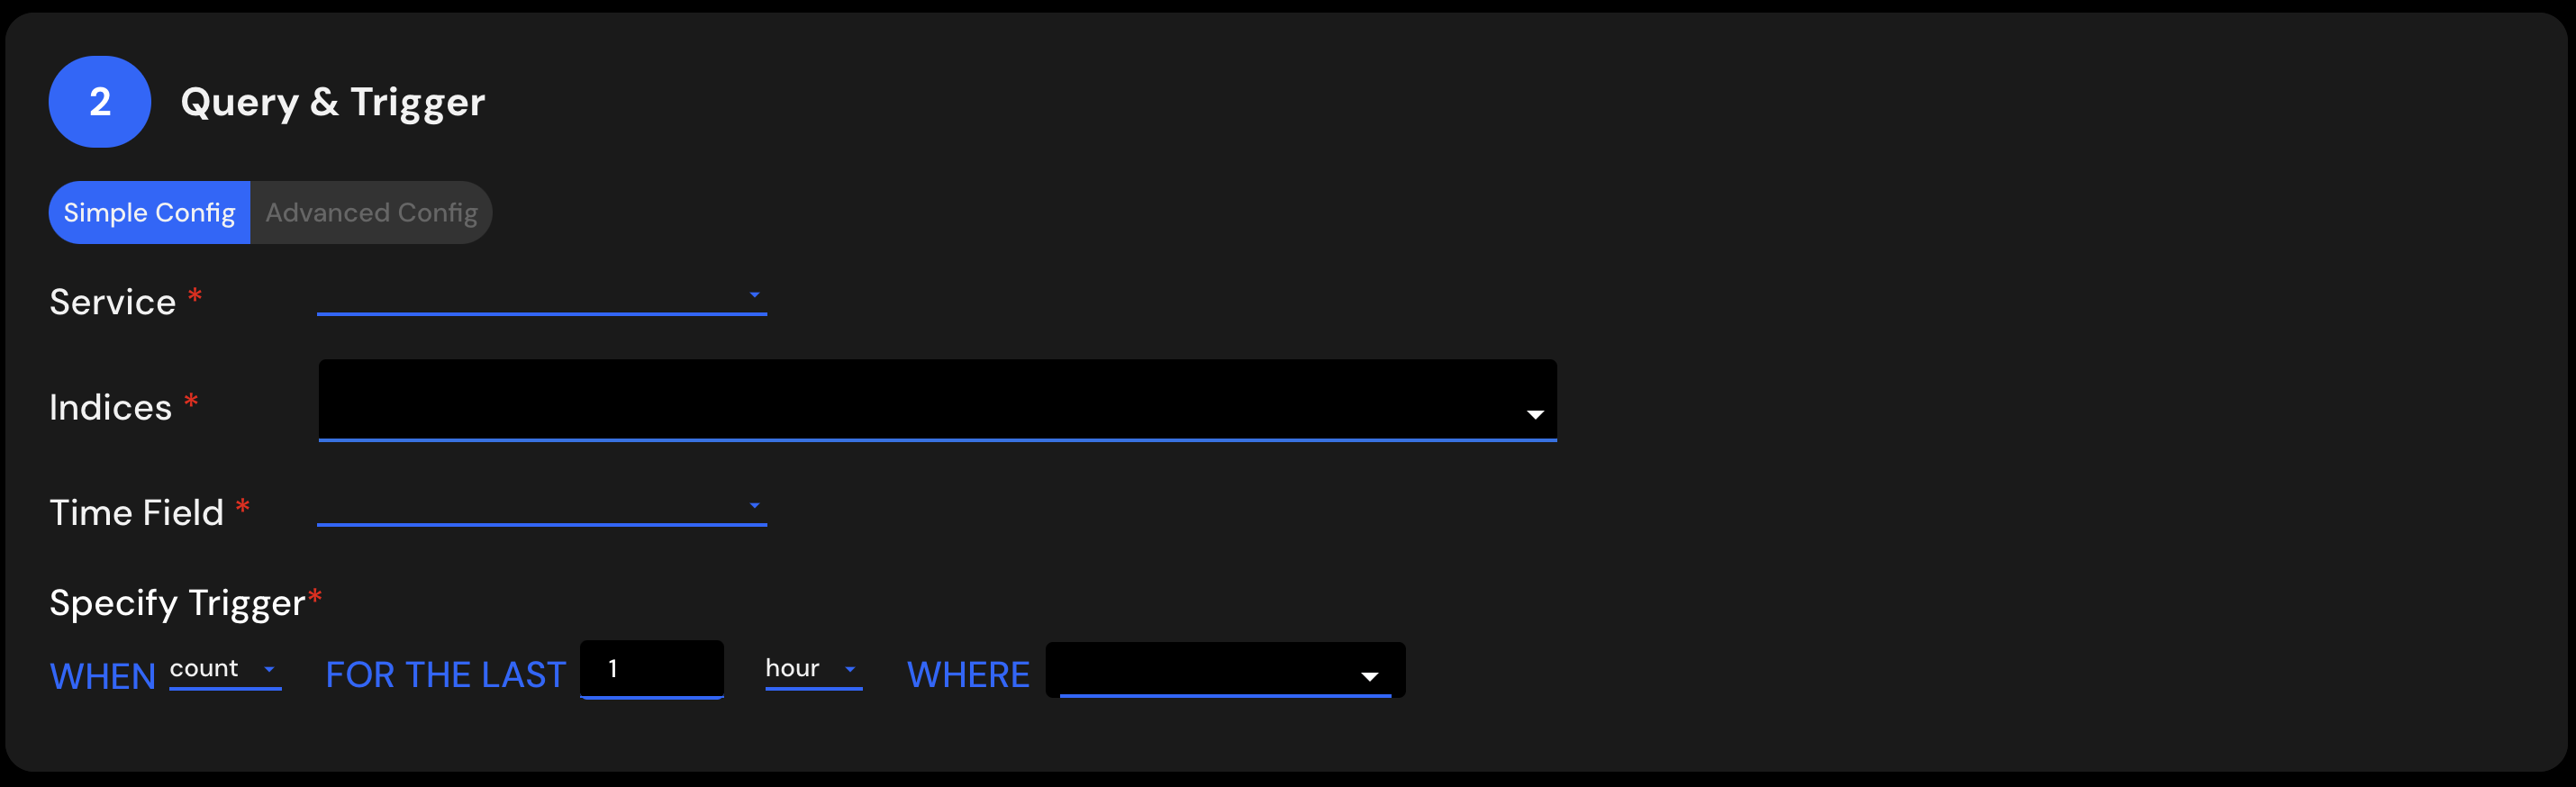
Step 2: Setting the Query & Trigger
The goal here is straightforward: to set a frequency threshold for the Key Error exception. You can use the Simple Config if you need only basic settings, or Advanced Config if you are familiar with Elasticsearch queries.
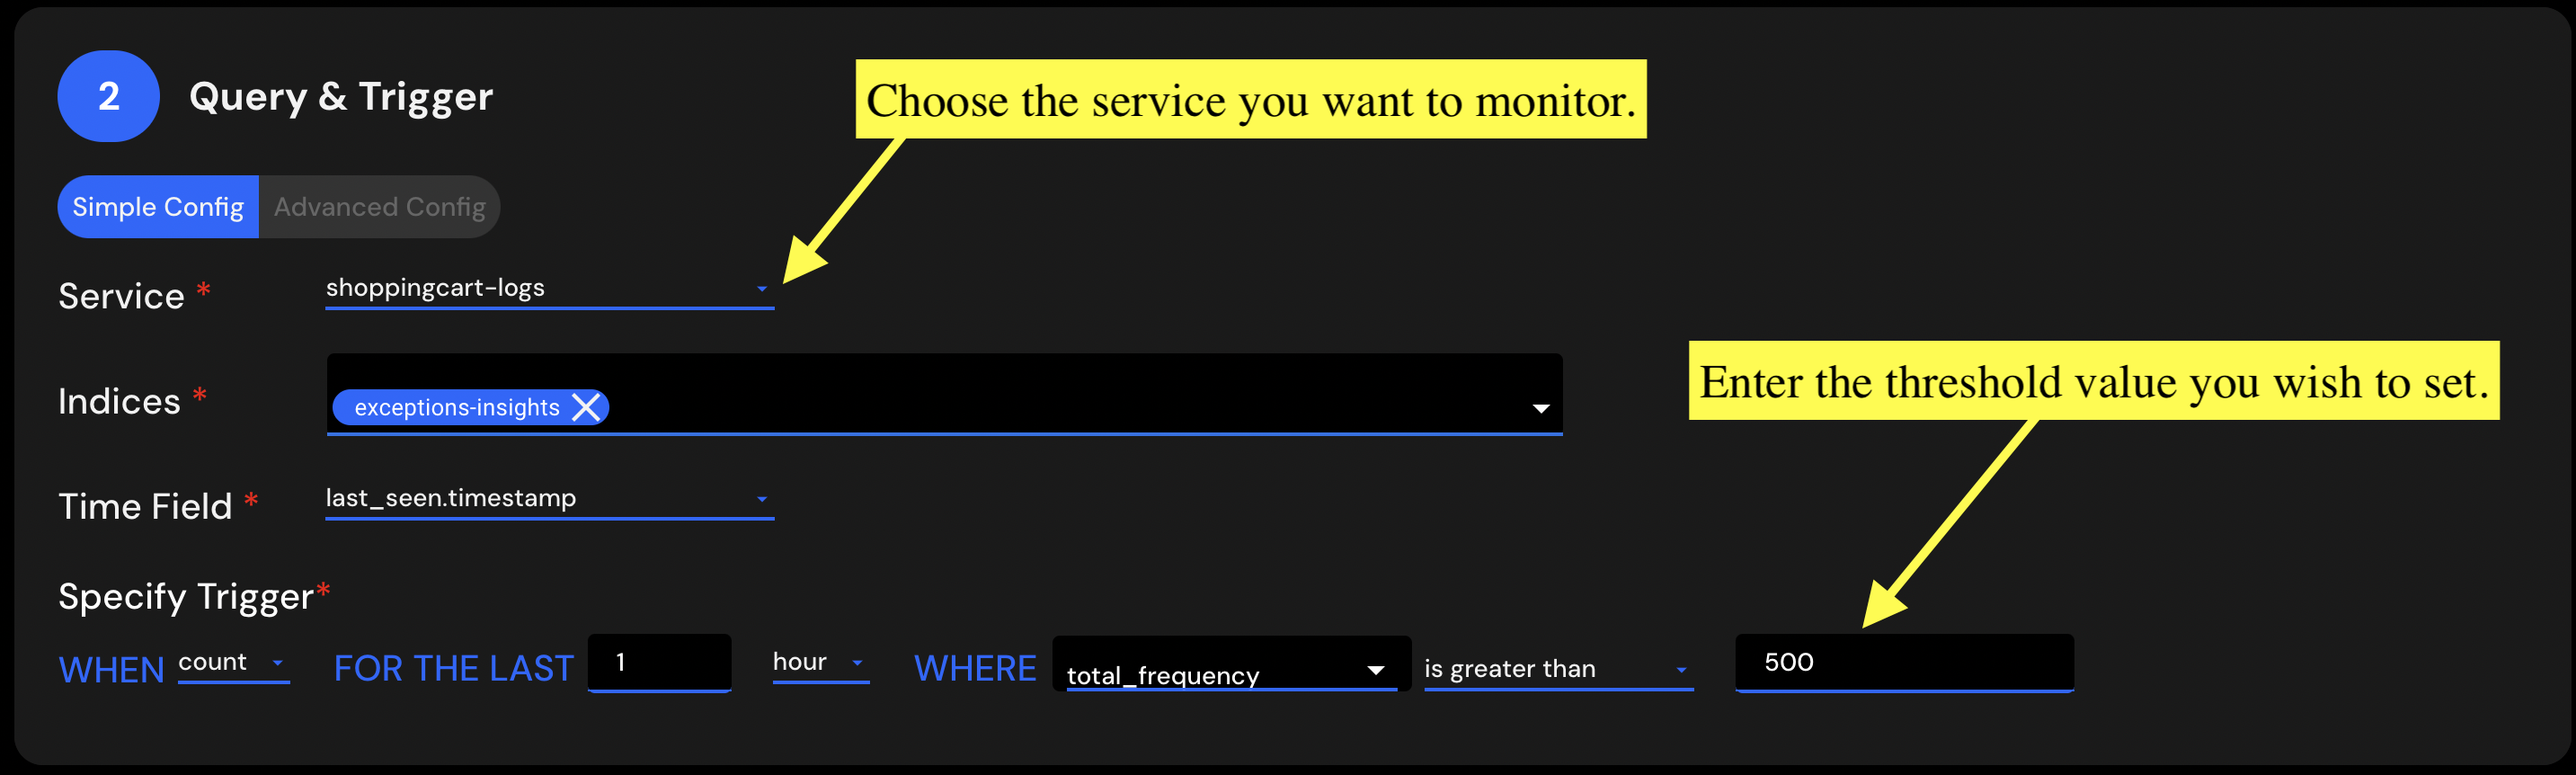
To configure the Query & Trigger for the Simple Config, follow these instructions:
- Select the service you wish to monitor from the Service dropdown.
- Choose the exceptions-insights index from the Indices dropdown, where all exception-related information is stored.
- From the Time Field dropdown, select the last_seen.timestamp field, which records the timestamp of the last occurrence of the exception.
- Since the goal is to activate the trigger when the exception frequency exceeds a certain threshold, choose the total_frequency field from the WHERE dropdown. Two additional input boxes will appear within the WHERE clause. Select the is greater than statement from the new dropdown menu and input the threshold in the last box.
Your final Query & Trigger section should resemble the following:
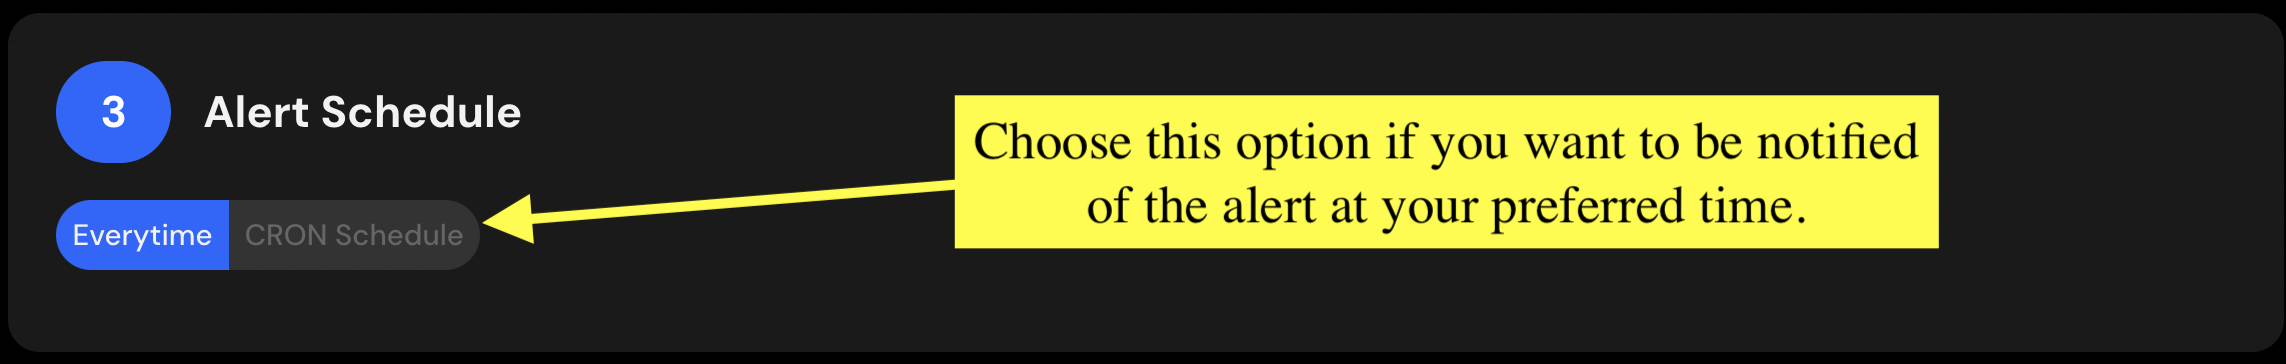
Step 3: Setting the Alert Schedule
This step is subject to personal preference. You may stick to the default Everytime schedule to run the query every 15 minutes, or manually enter a CRON schedule if you want a custom notification time.
Step 4: Configure Notification
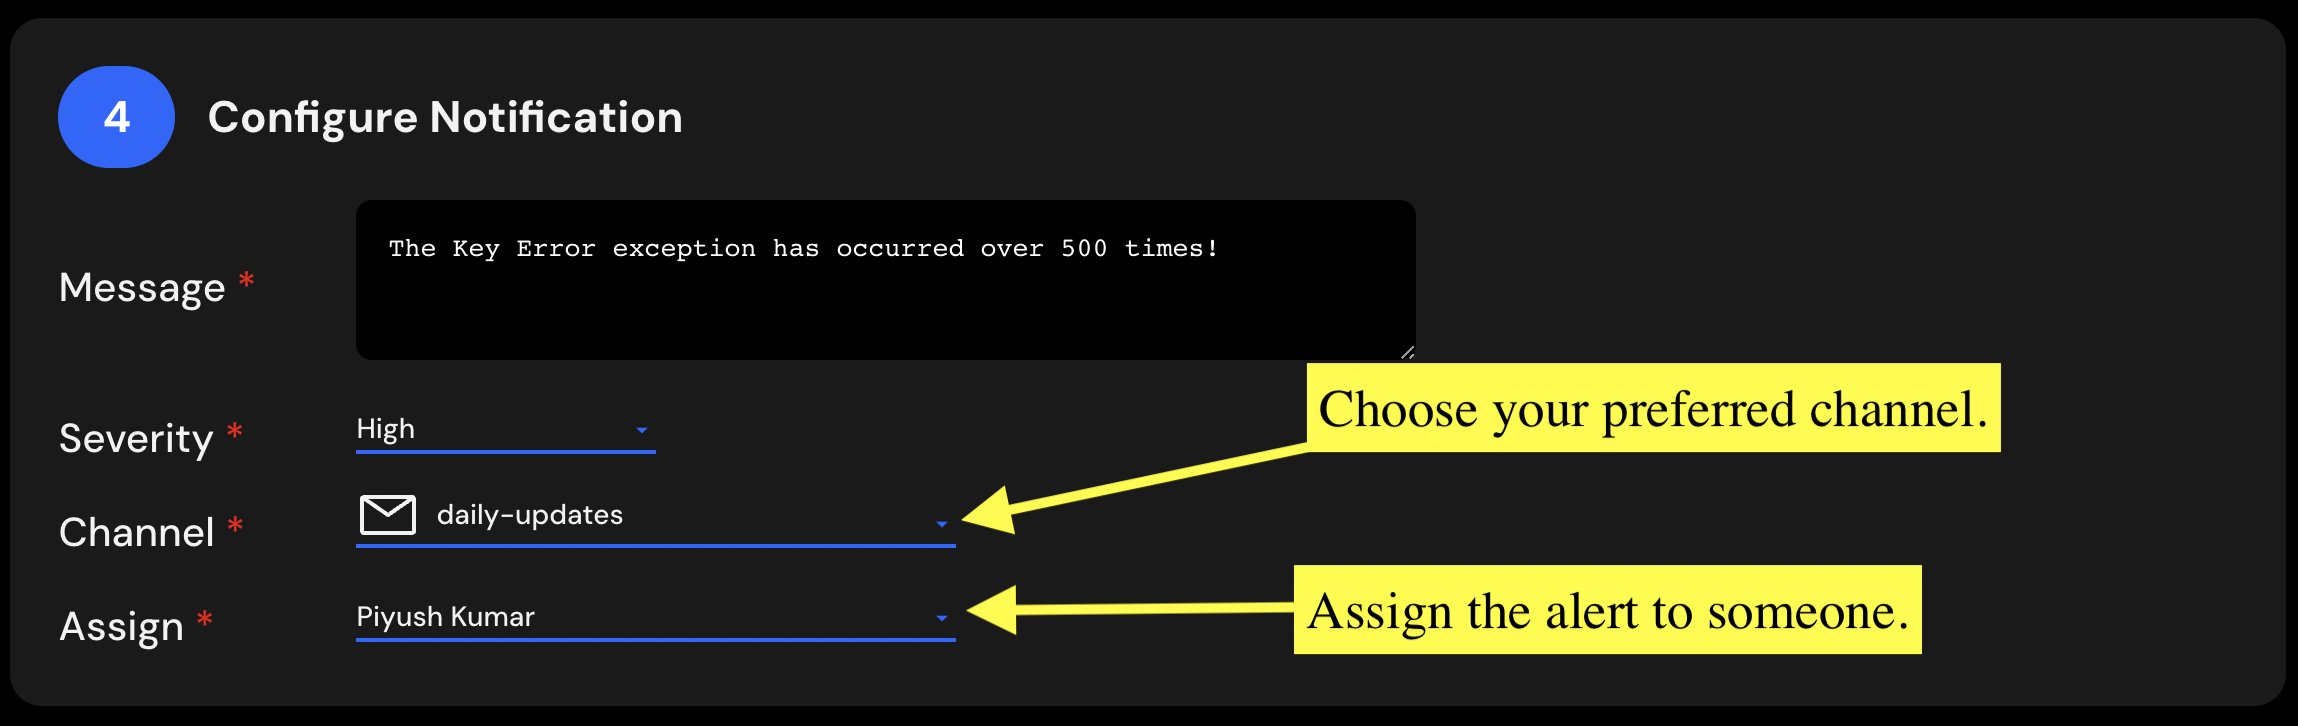
This step also depends on personal preference. Here's a guide to each of the fields in this section:
- Message: Input a detailed message, as this is what you will receive when the alert triggers.
- Severity: Given that this alert monitors an exception threshold, it should be set to High severity. Keeping exceptions in an application to a minimum is crucial.
- Channel: Select the notification channel where you want to receive the alert message.
- Assign: Assign the alert to a team member responsible for monitoring or resolving it once triggered.
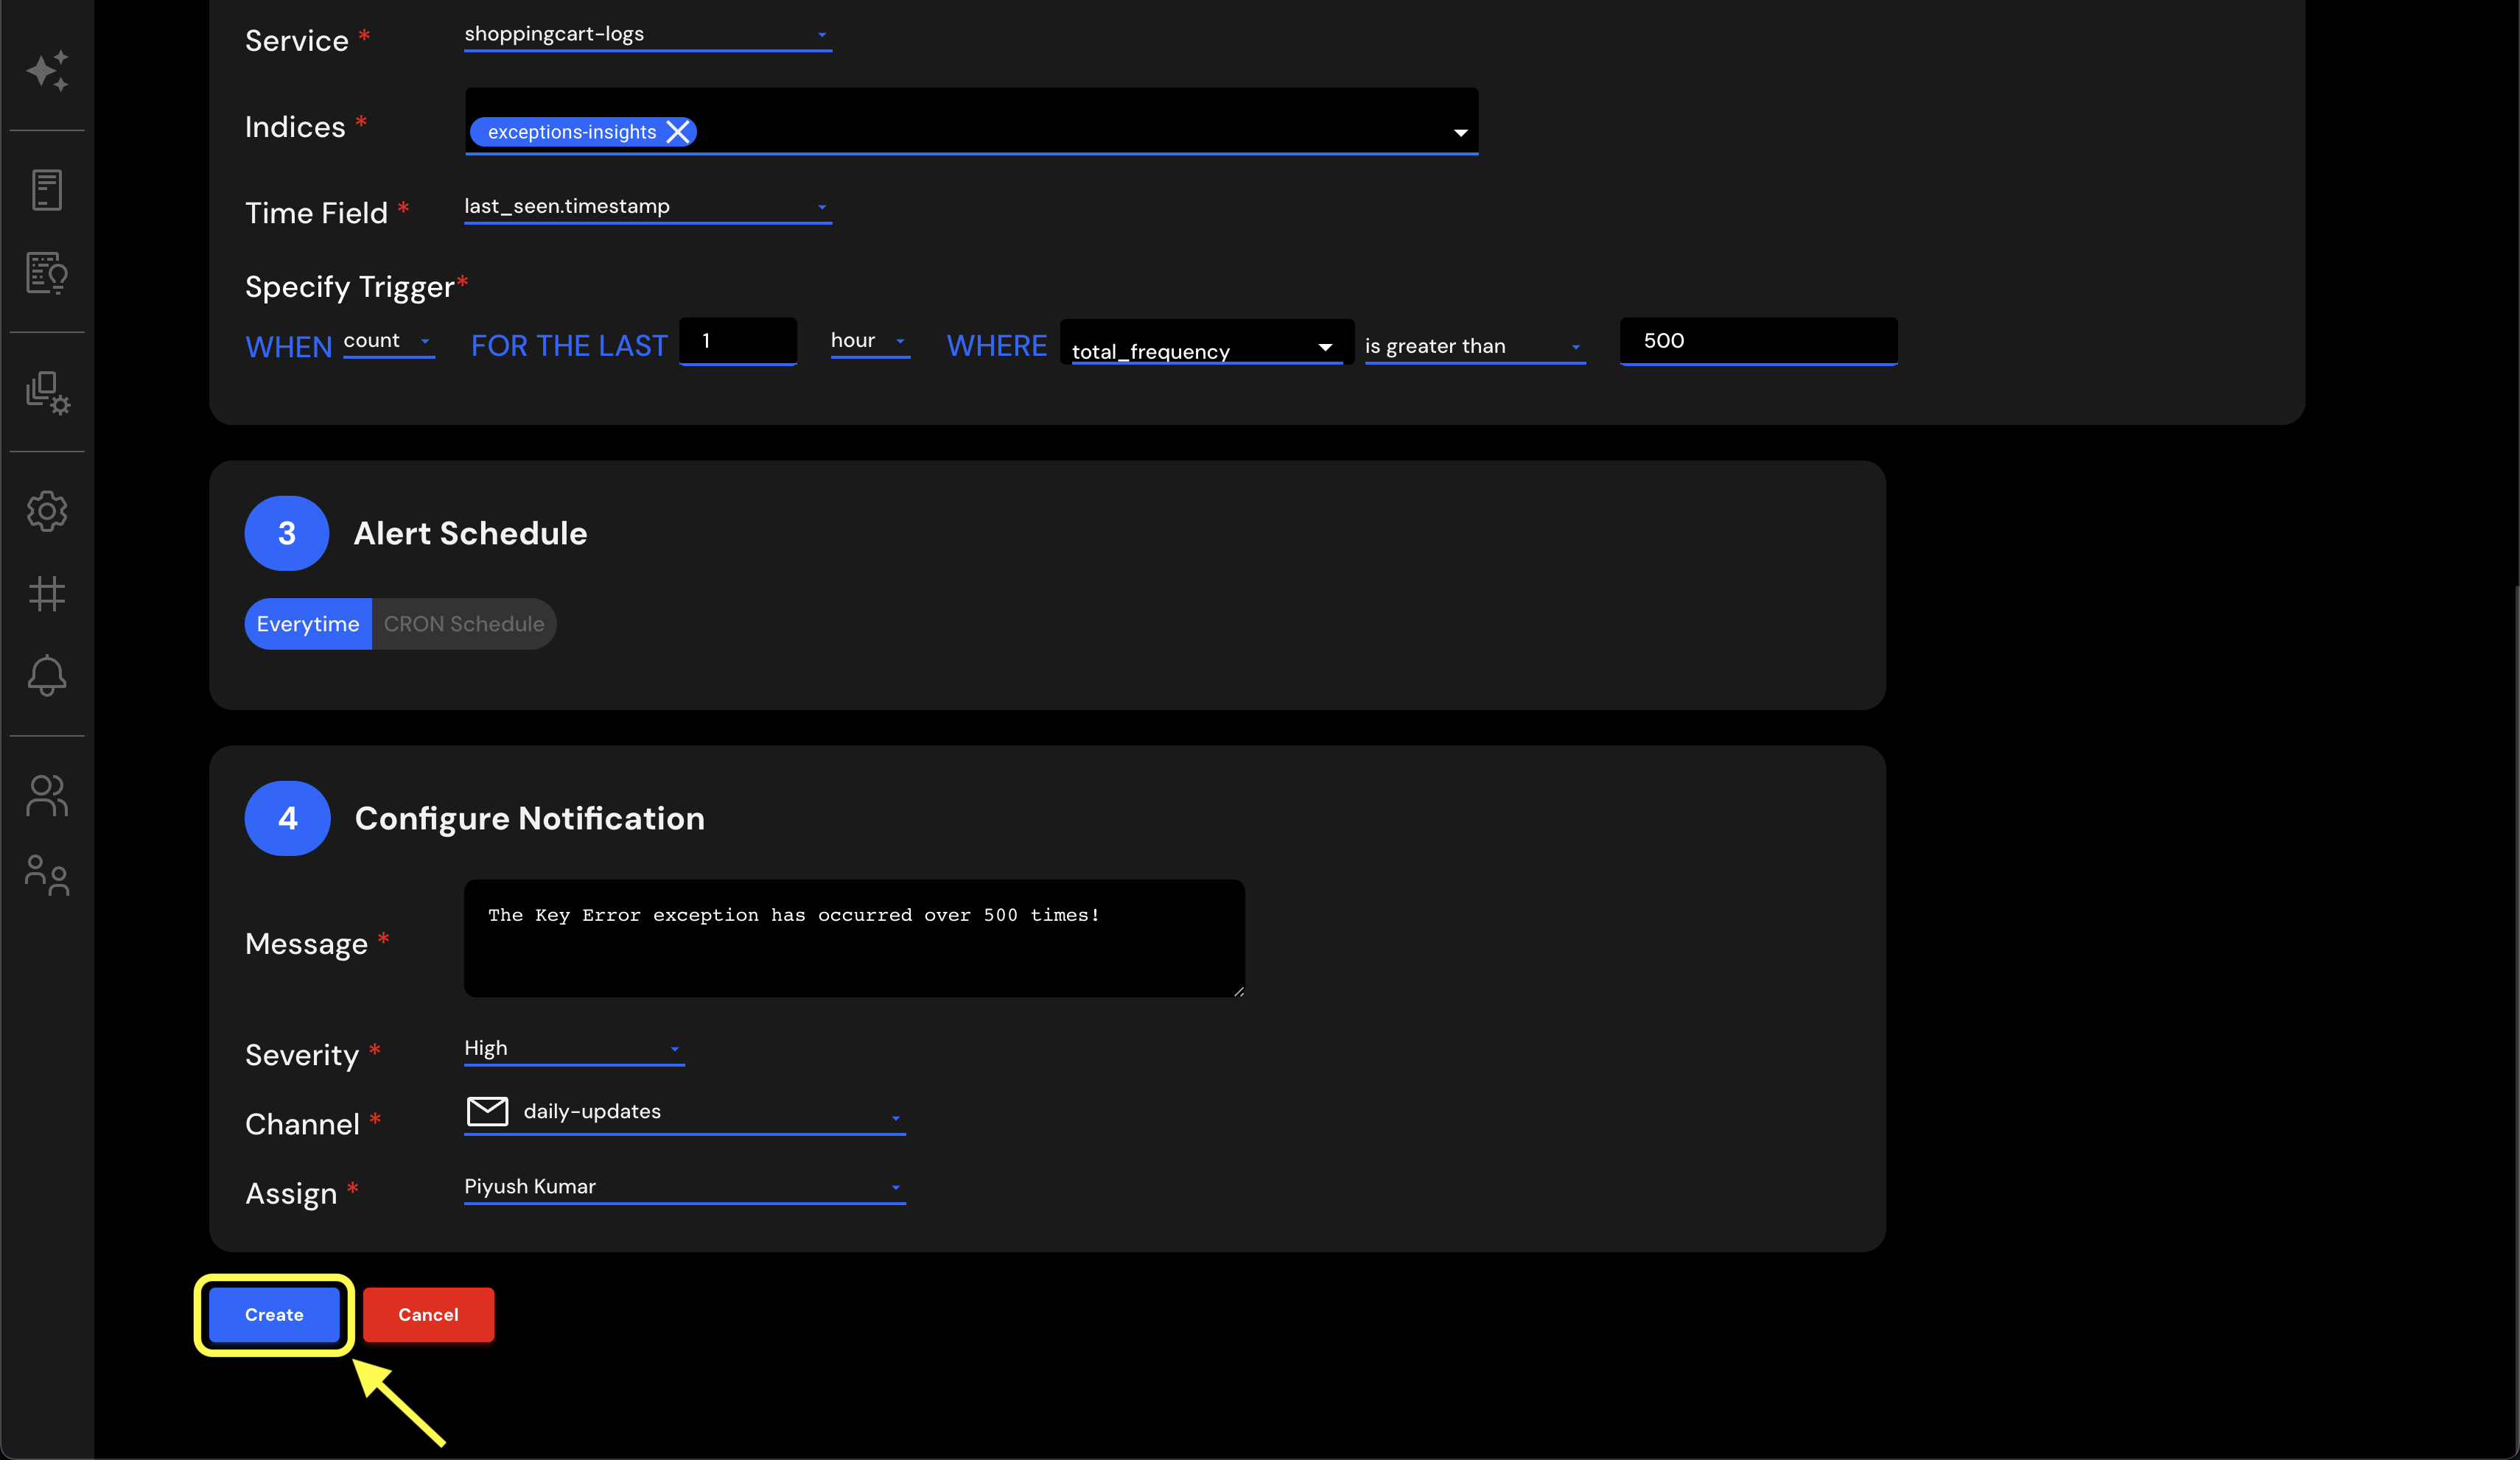
Step 5: Create the Alert
Once you fill out all the required fields, click on the Create button at the end of the page.
Conclusion
Setting up effective alerts is crucial for monitoring and maintaining the health of your system. By following this guide, you should now have a comprehensive understanding of how to configure alerts to monitor specific exceptions, set thresholds, customize notifications, and more.
The example walkthrough provided should aid you in tailoring alerts to your specific needs and requirements. As a result, you'll be equipped with the tools to enhance your system's responsiveness and proactivity.
Remember, a well-configured alert system doesn't just warn you about issues; it empowers you to anticipate, plan, and take decisive action. It fosters collaboration, enhances security, and contributes to a robust, resilient infrastructure.
For understanding the Query & Trigger section in more detail, please refer to the Query & Trigger Configuration Guide. For more information on Elasticsearch queries, check out the official Elasticsearch documentation.
Happy alerting!