Query & Trigger Configuration Guide
Overview
The Query & Trigger section is a crucial component when configuring an alert in Cloudaeye. It defines the conditions for an alert, specifying both the query to be processed at set intervals and the trigger to be fired once the query condition is met.
This guide aims to provide an in-depth explanation of how to utilize both the Simple and Advanced Config options within the Query & Trigger section, catering to various user needs and preferences.
Simple Config
Understanding Simple Config
The Simple Config option is designed to facilitate straightforward alert configurations. It's an ideal choice if you are new to Elasticsearch or if you need to set up a basic alert without delving into complex queries.
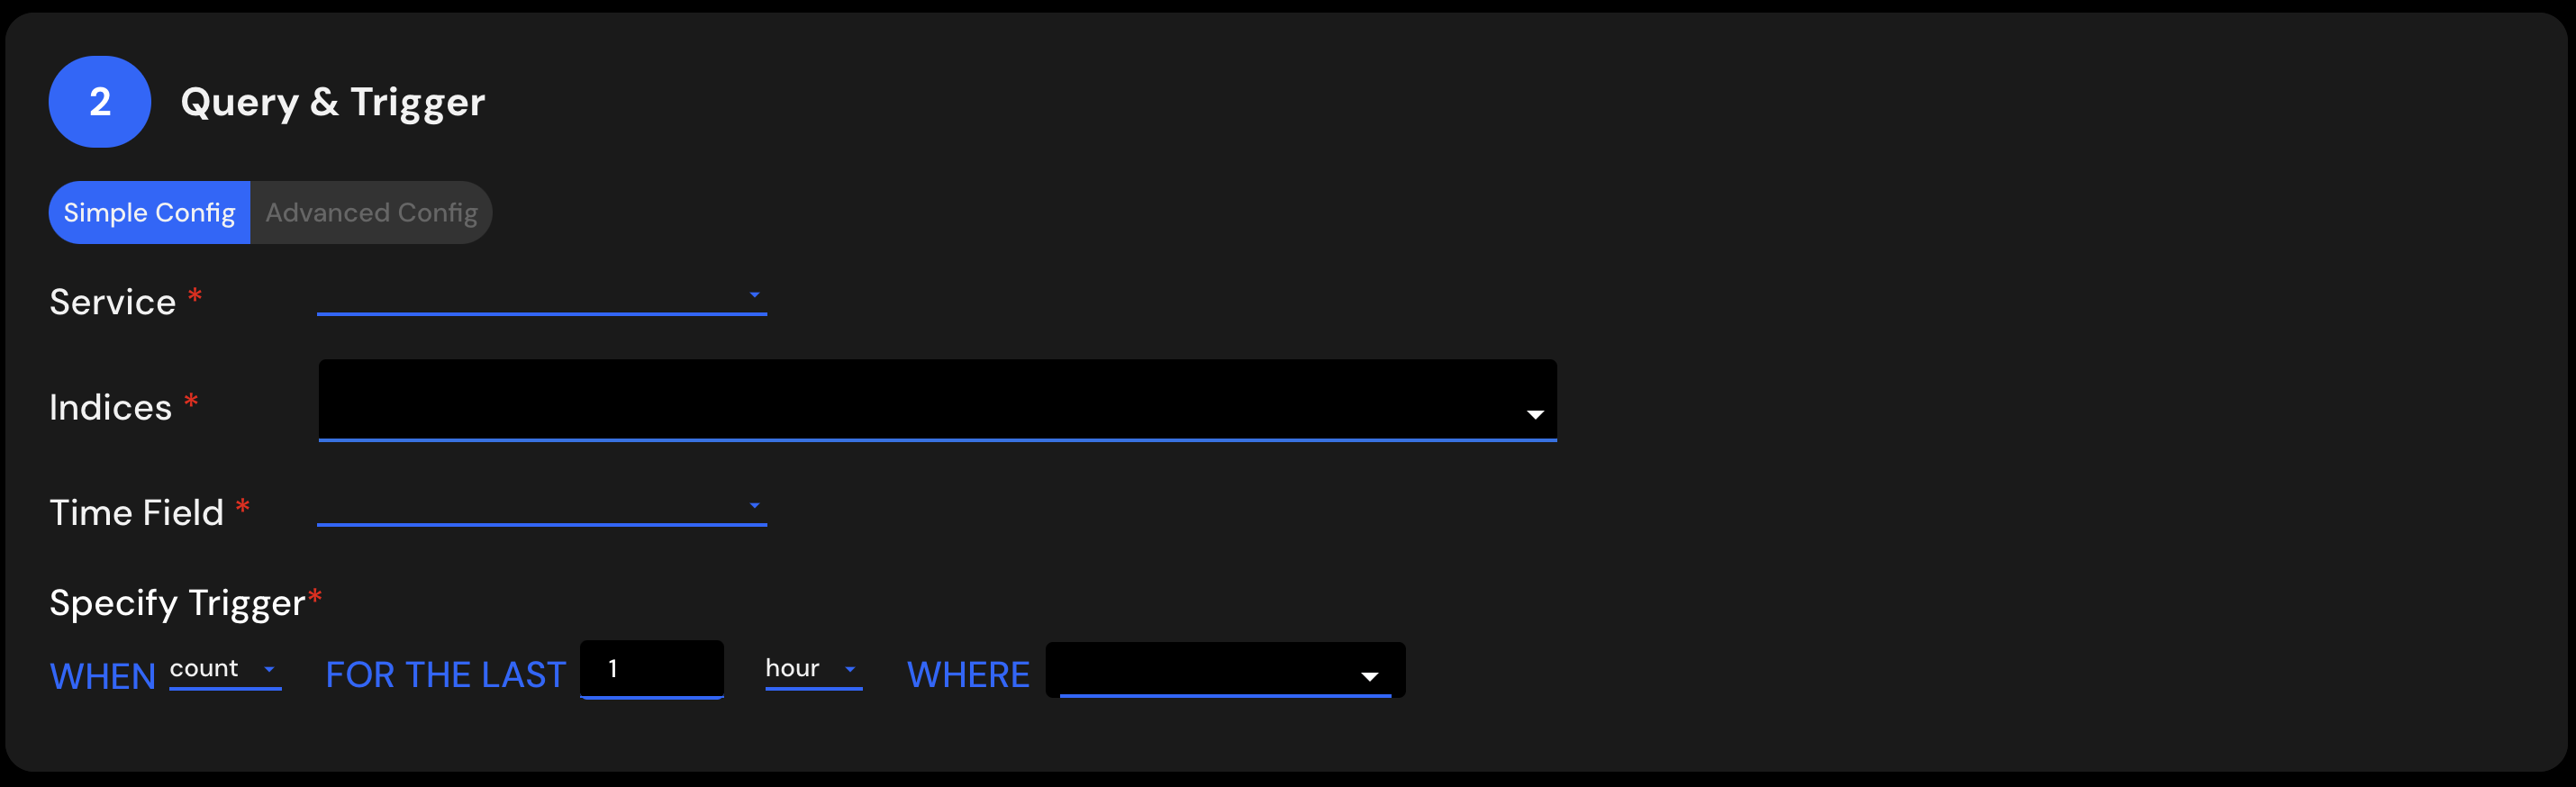
Configuration Steps
- Service: Select the service you wish to monitor.
- Indices: Choose the relevant index where the data is stored.
- Time Field: Pick the field recording the timestamp.
- WHEN: Select the type of aggregation you want to perform on the data. This dropdown menu contains options such as average, count, min, max, etc., which determine how the data will be processed for the alert.
- FOR THE LAST: Specify the time range for the data to be evaluated. This could be the last 15 minutes, last hour, last 24 hours, etc., depending on your needs.
- WHERE: Define the condition, such as a threshold for a specific field.
Refer to the Example Configuration for a step-by-step walkthrough using the Simple Config.
Advanced Config
Understanding Advanced Config
The Advanced Config option provides more control over alert configuration by allowing you to write queries using Elasticsearch Query DSL. It offers flexibility and specificity, suitable for complex alerts and expert users.
Working with Query DSL
Query DSL (Domain-Specific Language) is a language used in Elasticsearch to define queries. You can use it to create intricate queries to meet specific alerting requirements.
Basic Structure
A typical Query DSL might look like this:
{
  "query": {
    "match": {
      "field": "value"
    }
  }
}
Resources
Elasticsearch Query DSL Documentation: Comprehensive guide on writing queries in Query DSL.
Configuration Example for Advanced Config
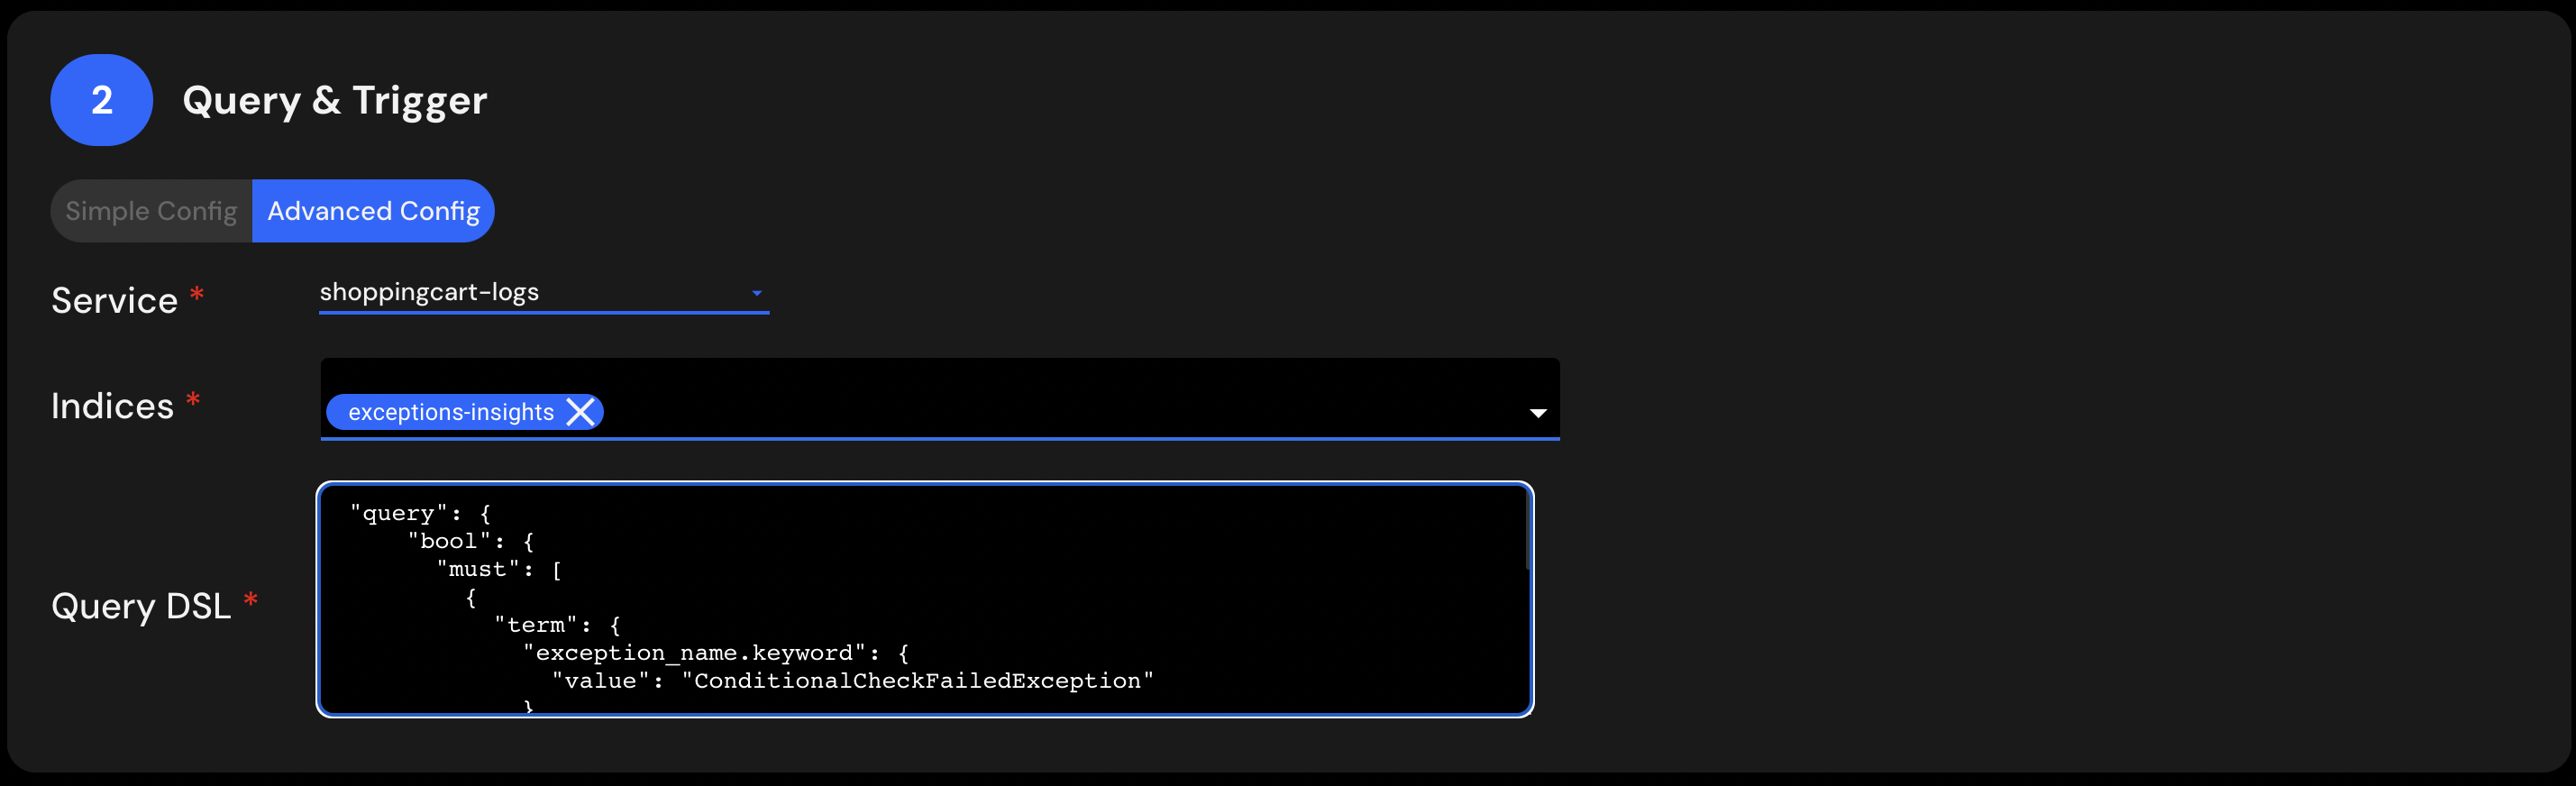
The Advanced Config allows for more granular control of the query and triggers, offering the possibility to write and test custom Elasticsearch queries using Query DSL. Here's an example configuration:
- Open Advanced Config: On the Query & Trigger section, click on Advanced Config to reveal the DSL input field.
-
Write Your Query: Input or paste your Elasticsearch Query DSL. A typical query might look like this:
{
    "query": {
        "bool": {
        "must": [
            {
            "term": {
                "exception_name.keyword": {
                "value": "ConditionalCheckFailedException"
                }
            }
            },
            {
            "range": {
                "total_frequency": {
                "gt": 1000
                }
            }
            }
        ]
        }
    }
}
In this example, the query will catch the document for
ConditionalCheckFailedExceptionif it occurrs over 1000 times. -
Test Your Query: Always test your queries using the available tools to ensure they behave as expected.
-
Save and Monitor: Once you are satisfied with the query and trigger, save your configuration. The alert will be monitored according to the specified conditions.
Elasticsearch Monitors
Elasticsearch monitors are automated jobs that continuously run configured queries at specified intervals. In Cloudaeye's alert system, they operate behind the scenes to ensure that the defined alert conditions are constantly evaluated.
How Monitors Work in Cloudaeye
When you define a query and trigger in the alert configuration, an Elasticsearch monitor is automatically created and configured in the backend. Here's an overview of how it functions:
-
Query Execution: The monitor periodically executes the defined Elasticsearch query (either simple or advanced) based on the frequency set in the alert configuration.
-
Condition Evaluation: The results of the query are analyzed to determine whether the conditions defined in the trigger have been met.
-
Triggering Alerts: If the conditions are satisfied, the monitor triggers the alert actions as configured (e.g., notifications, logging, etc.).
-
Continuous Monitoring: The monitor continues to run at the defined intervals, re-evaluating the conditions and triggering the alert as necessary.
Implicit Integration
The use of Elasticsearch monitors in Cloudaeye is seamless and implicit. You don't need to manage the monitor directly or understand the underlying mechanics to benefit from its capabilities. The abstraction of this functionality allows you to focus on defining the alerts that meet your needs, with the confidence that the monitors are efficiently managing the continuous evaluation and response.
Further Resources
- Elasticsearch Alerting: A guide on the fundamental concepts and features of Elasticsearch monitoring and alerting.
- Opensearch Monitors: A comprehensive guide to understanding and using Opensearch Monitors, providing details on how to configure, analyze, and manage alerts using Opensearch, a successor project to Elasticsearch.
The integration of Elasticsearch monitors within Cloudaeye's alerting system enhances the flexibility, responsiveness, and reliability of alerts, enabling a robust and tailored alerting experience.
Conclusion
The Query & Trigger section is the heart of alert configuration, offering two paths: Simple Config for ease of use, and Advanced Config for granular control. Understanding both options empowers you to craft precise and effective alerts, aligned with your monitoring needs and expertise. Explore the links provided to deepen your understanding and mastery of Elasticsearch queries and triggers. Whether you're a novice or an expert, this guide serves as a robust resource for fine-tuning your alerting strategy.