View Logs
Overview
CloudAEye logs service provide the ability to view logs with a sophisticated dashboard. This topic describes how user may use the dashboard.
Videos
- Tutorial: Explore Logs
Prerequisites
- A logs service is created
- An application is configured to stream logs to the logs service
View Logs
CloudAEye Dashboard
Select Logs Service from the left navigation. You will see a list of created logs services.
Click on a service under Service Name column. You will see a logs service details page.
From the logs service details page, click on the CloudAEye Dashboard button (see bellow).
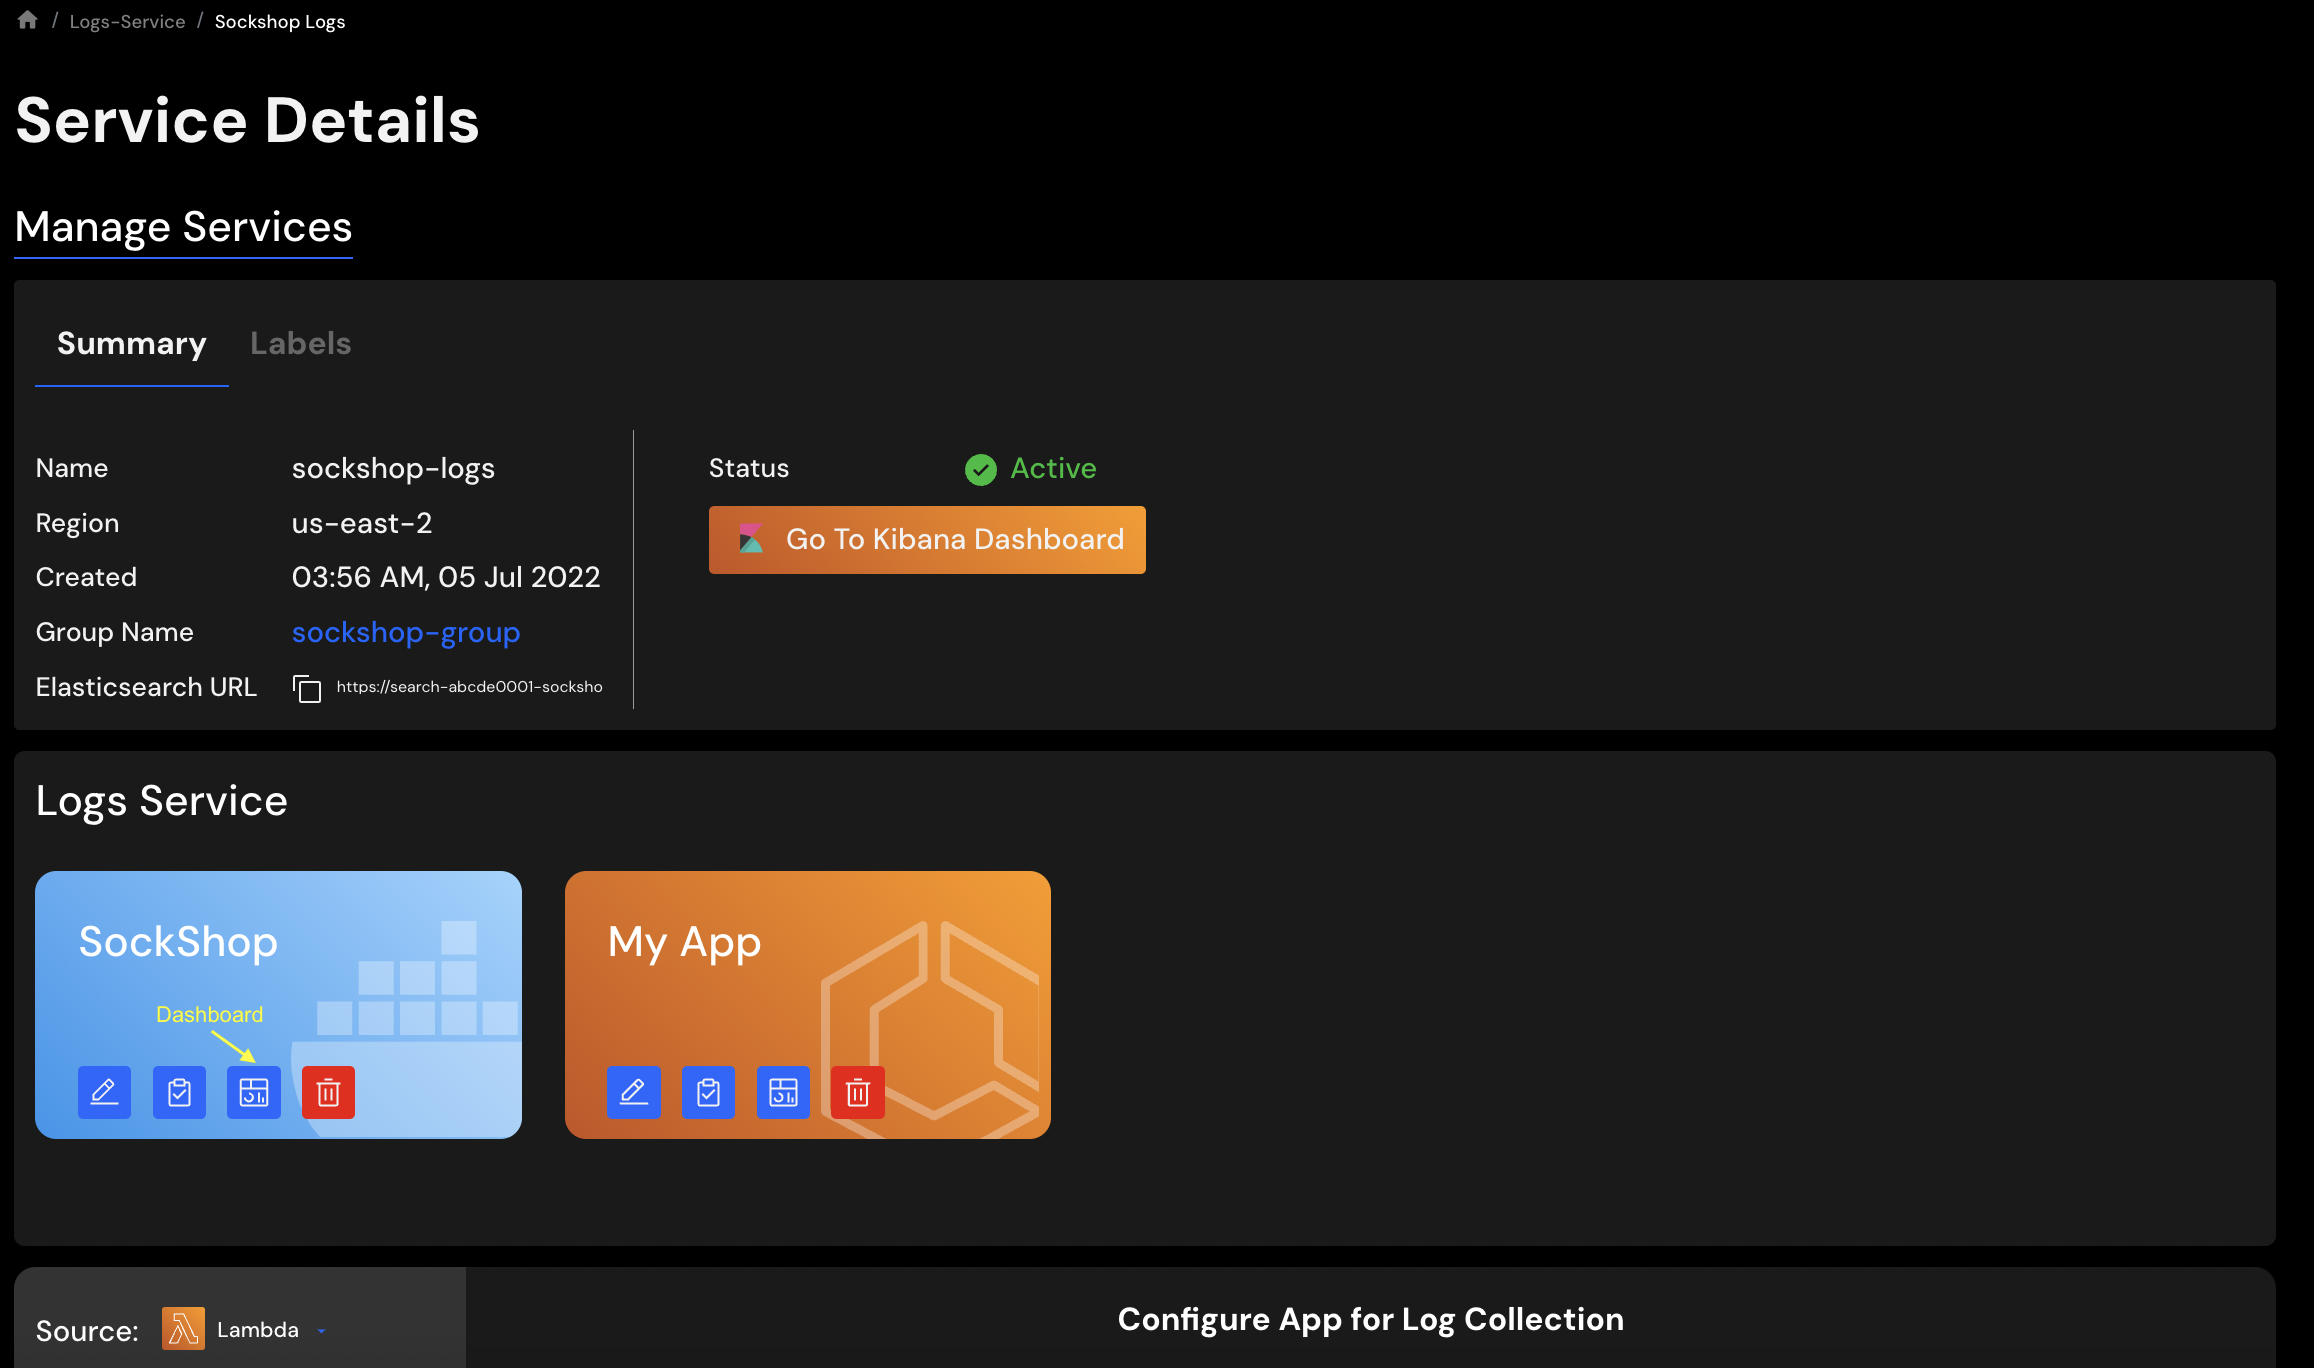
You will see the Explore Logs tab that allows you to see the log messages.
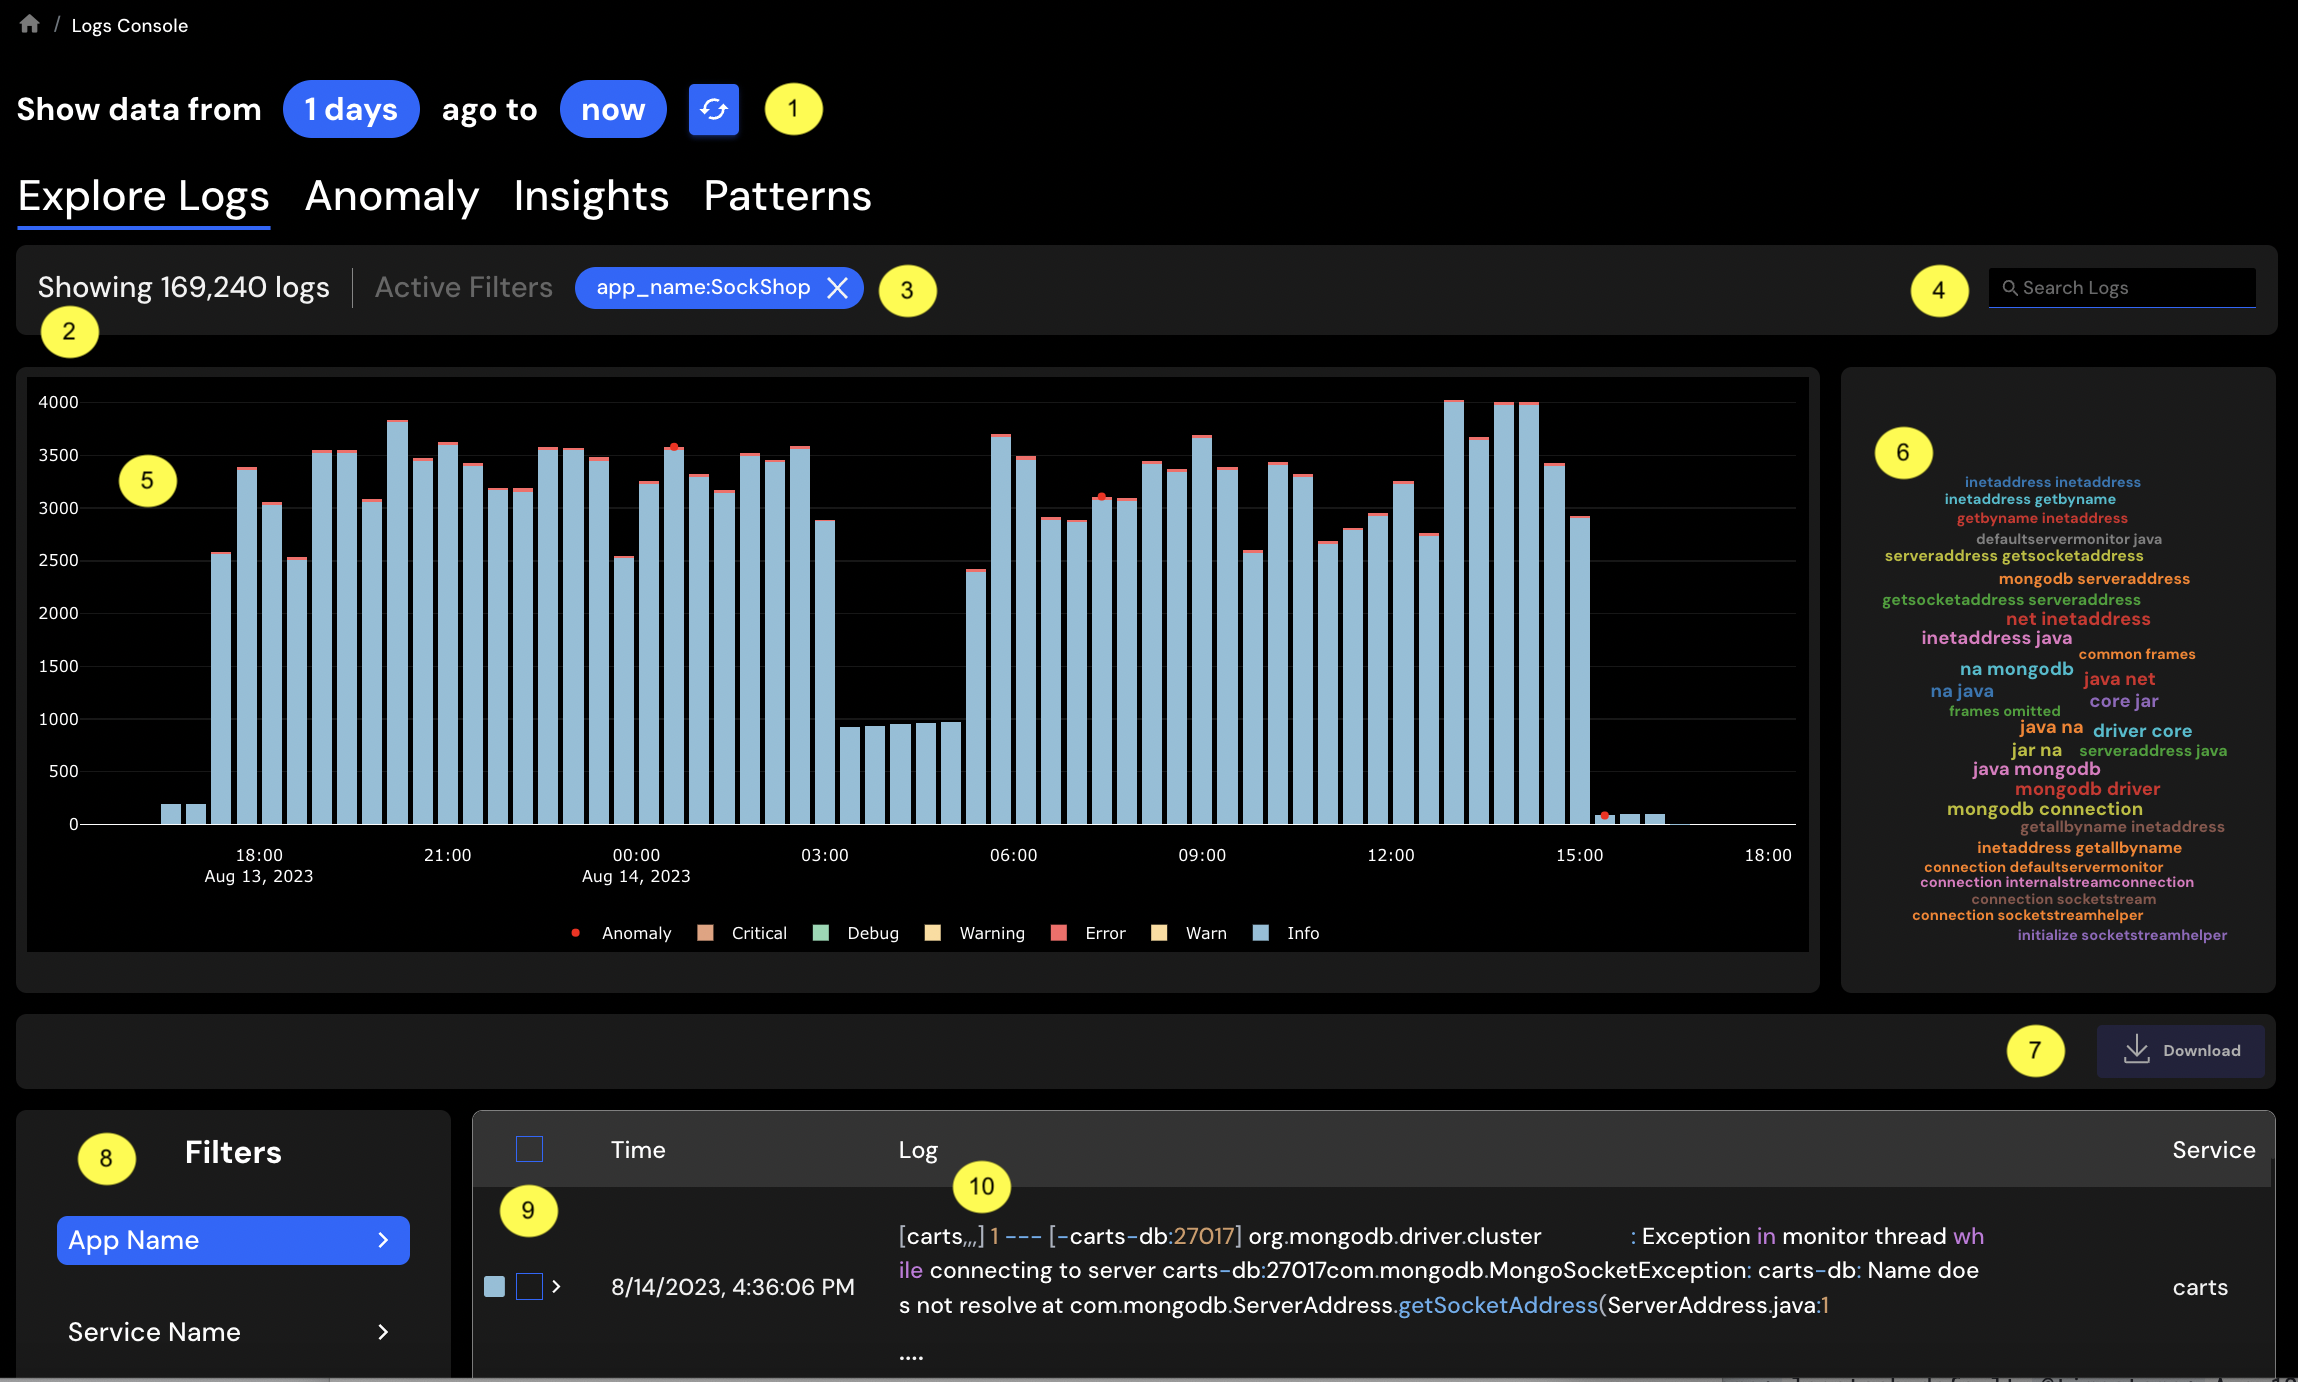
Explore Logs dashboard shows the following:
- Search Duration: The dashboard opens showing data for last 1 day. You may change the search duration.
- Search Results: The search and filter status shows number of logs returned from search query based on the duration.
- Active Filters: The filter status shows the active filters.
- Search: The top right section shows a search box. You may use this to seach information among the logs.
- Log Ingestion Activity: The dashboard shows number of log messages ingested over time as bar graph. Each bar shows the types of log messages.
- Tag Cloud: On the right side of the log ingestion bar graph, you can see tag cloud from the log messages.
- Download Button: The
Downloadbutton allows you to download log messages you select. - Filters: The filters section allows you to apply different filters.
- Select All: The select all checkbox allows you to select all logs to download.
- Logs: The table on the right shows the parsed logs based on the query criteria.
Kibana Dashboard
CloudAEye logs service provide the ability to view logs with Kibana (now OpenSearch ) dashboard.
Click on Go to Kibana Dashboard button on the logs service details page to see the dashboard.
This will open an authentication dialogue. Provide your username and password and click on Sign in button.
You will see the Home page.
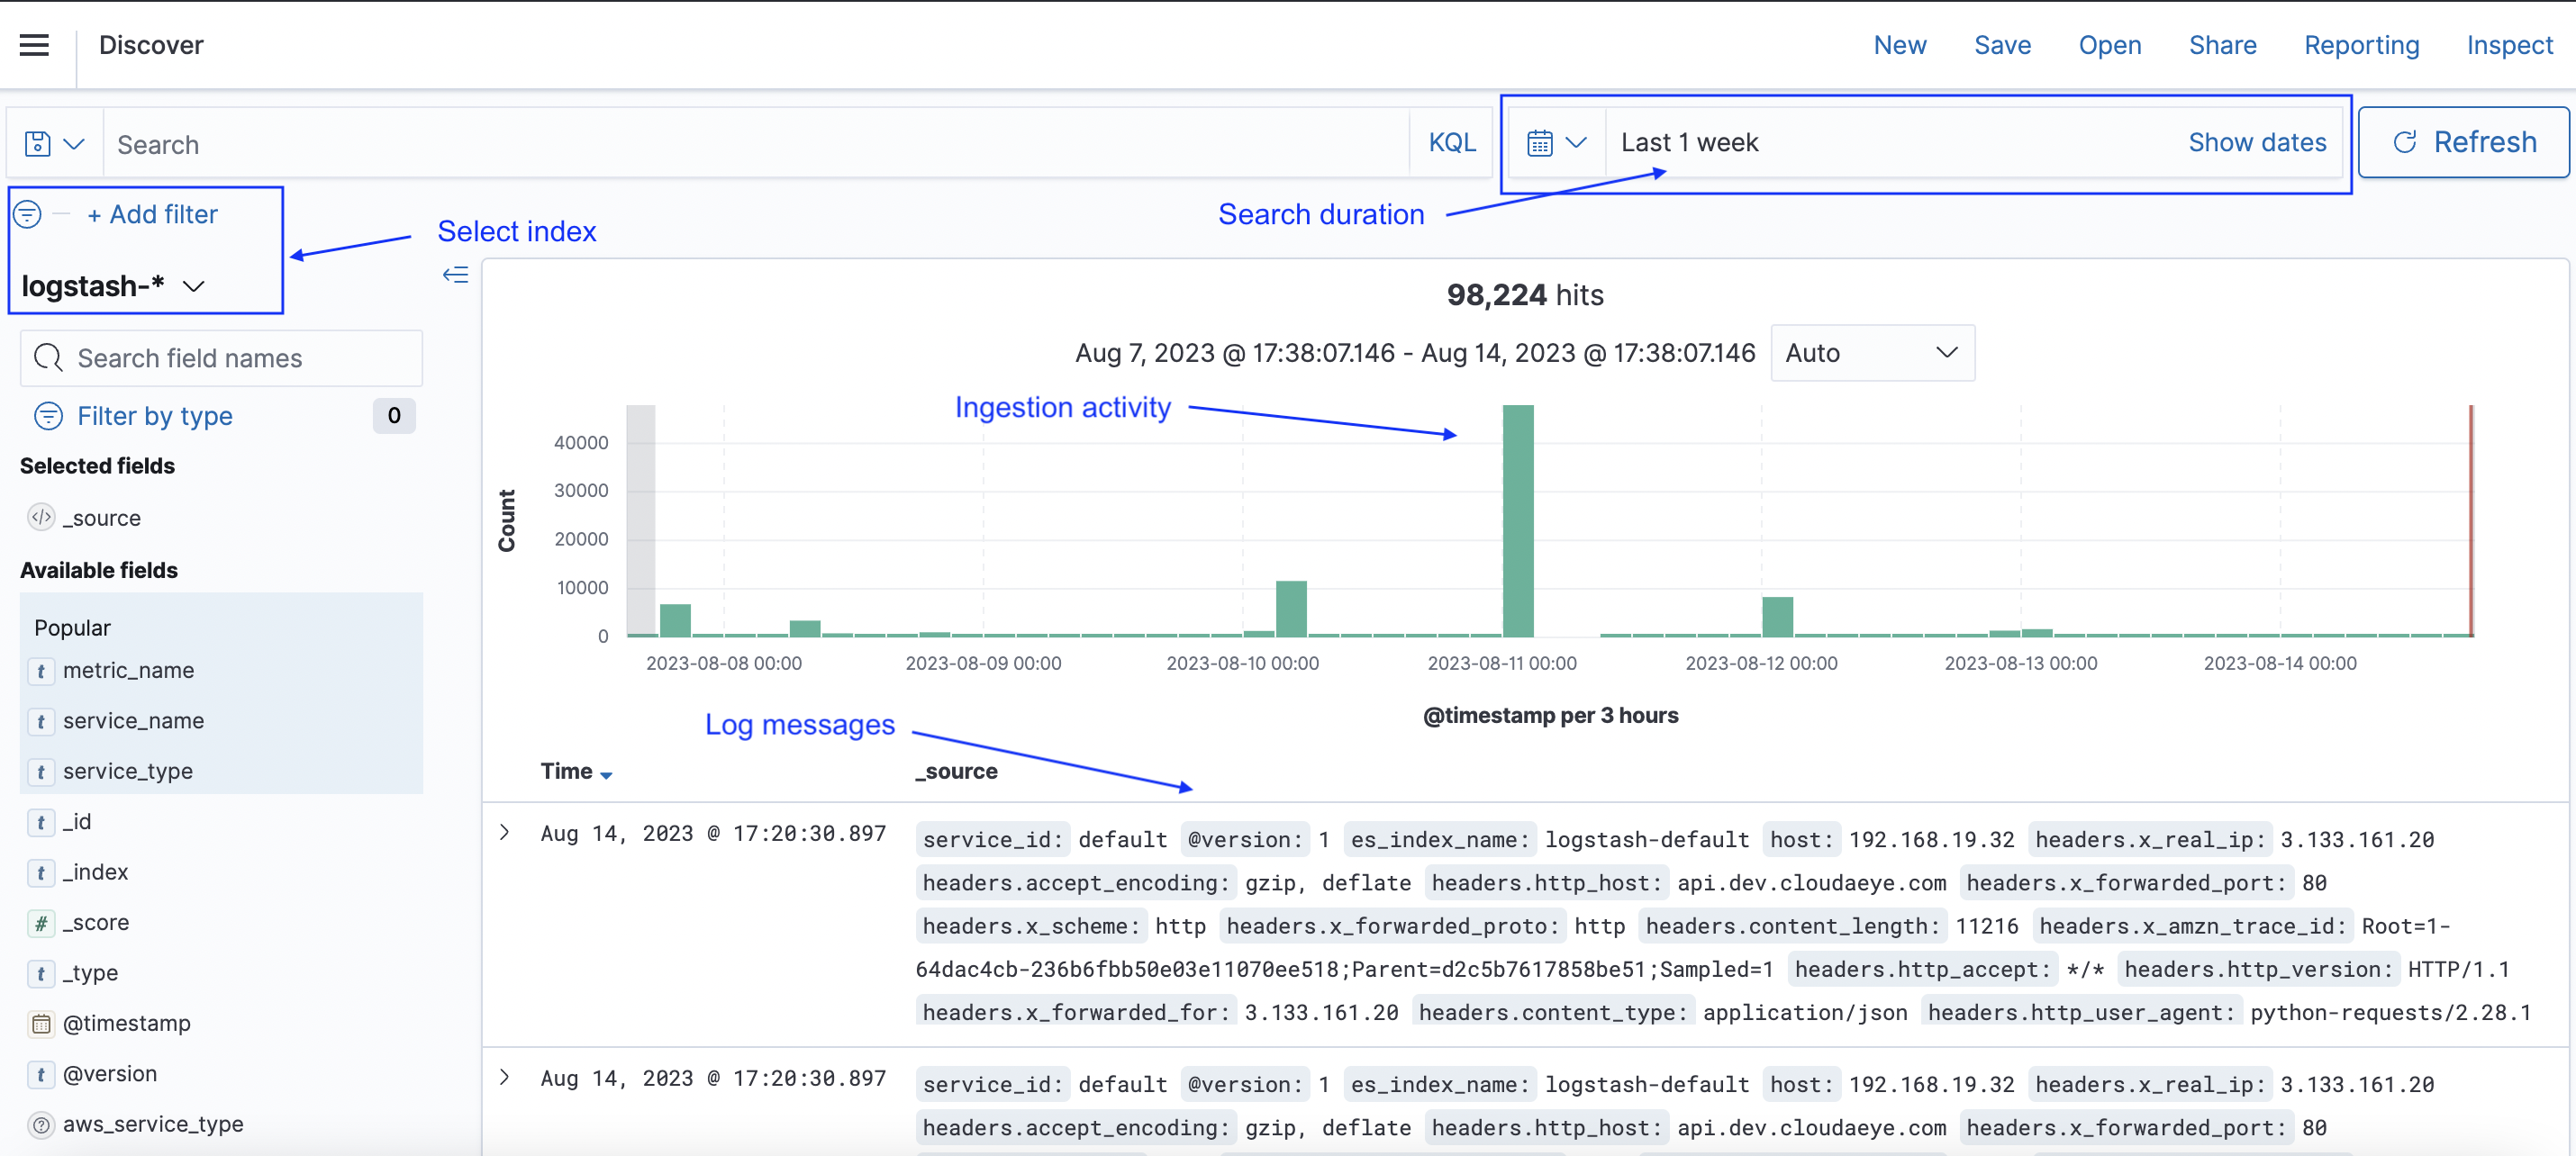
From the left menu, click on Discover.
You will see a dashboard with log messages for the last 15 minutes.
Under filter, select logstash-*. On the top right cornoer, update the date range to change the query duration.
Dashboard URL
The URL for dashboard is {serviceEndpoint}/_plugin/kibana/
Indexing Data
For advanced use-cases, user may create index in the dashboard. You must not change the CloudAEye indexes. Please do not create more than two indexes as it may destabilize the logs service. You may use Kibana dashboard to visualize the data. Here are some examples from the official documentation on creating index for your reference.
Index API
PUT <index>/_doc/<id>
{ "A JSON": "document" }
Bulk API
POST _bulk
{ "index": { "_index": "<index>", "_id": "<id>" } }
{ "A JSON": "document" }
Automatic Index Creation
POST movies/_doc
{ "title": "Spirited Away" }
Specify Index ID
To specify an ID of 1, use the following request:
PUT movies/_doc/1
{ "title": "Spirited Away" }
Naming Restrictions
Indices have the following restrictions:
- Only lowercase letters are allowed
- Names cannot begin with _ or -
- Names can not contain spaces, commas,
:,",*,+,/,\,|,?,#,>, or<
Dashboard Authentication
Users from the following groups are automatically congirued for authentication for logs dashboard:
- TenantAdminGroup,
- TenantUserGroup,
- LogsServiceAdminGroup,
- LogsServiceUserGroup
CloudAEye SaaS uses resource-based policy to greant acess to only logs services for an account. This guarantees isolation of data and access across tenant.
View Log Alerts
Refer to alerts for more details.