Log Management Architecture
Overview
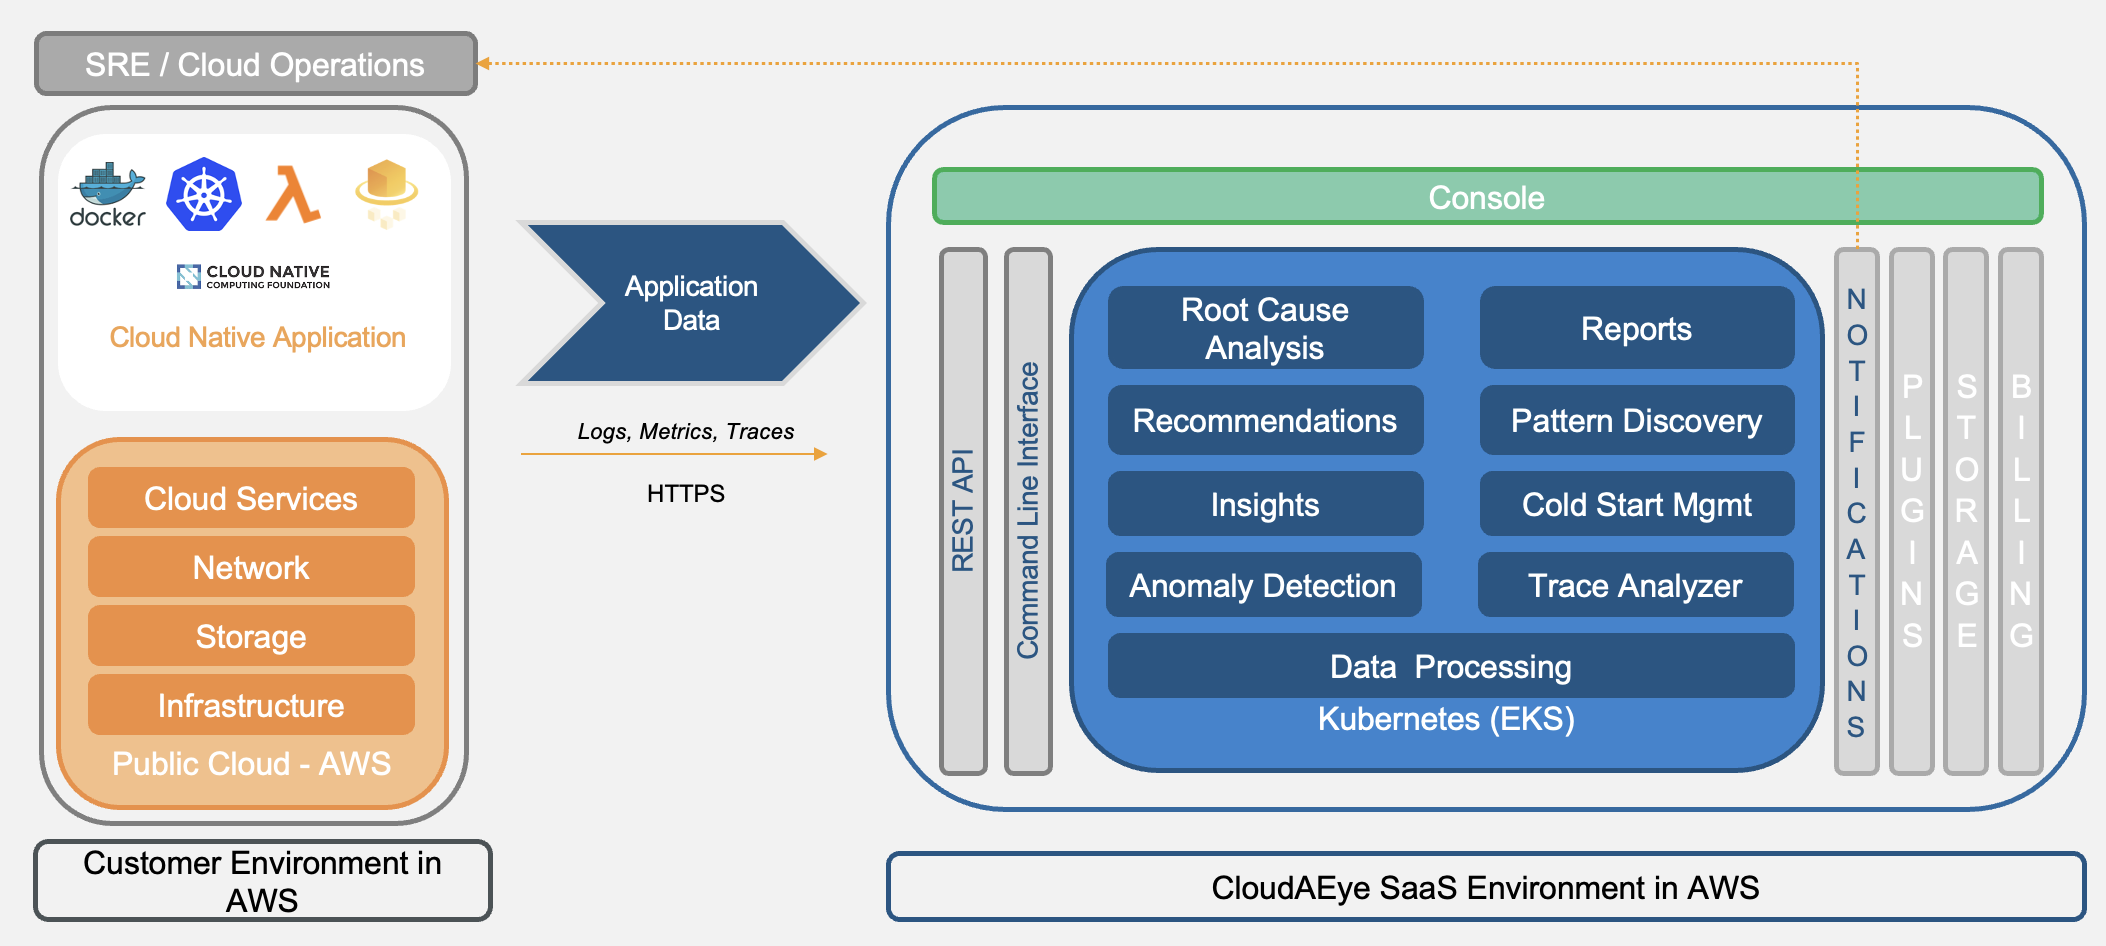
CloudAEye SaaS (Software-as-a-Service) delivers AI-powered observability solution for distributed cloud application management. This topic describes the high-level architecture.
Architecture
There are three major components in this architecture:
- Customer applications running in their envrionments
- CloudAEye observability platform
- AI/ML models that delivers intelligent automation to simplify user's cloud operations
How It Works?
Customer may be running distributed cloud native applications on AWS cloud in their own VPC (Virtual Private Cloud). CloudAEye SaaS running in a seperate AWS account and VPC is designed to deliver intelligent observability solution for customer's applications.
CloudAEye AI/ML models can identify an anomaly, contextualize it and find the root-cause by identifying the micro-service in a dependency graph of customer's application. The automatic detailed analysis empowers customers to quickly test fixes and resolve the issue.
Agents
Logs and metrics from customer's applications are instrumented (one time setup) to send data to CloudAEye SaaS. The data is sent over HTTPS. For examples, refer to Logs Agent and Configure Log Streaming to learn more.
Integrations: AWS Services
CloudAEye provides mechanism to collect AWS services logs and metrics. This is an optional feature that customer may configure. This integration makes logs and metrics collection, storing and analysis of the time-series data easier for customer's distributed cloud applications. Refer to AWS Services Introduction to learn more.
SaaS Services
In CloudAEye SaaS, customer may create one or more backing stores for logs and metrics service. For an example, refer to Create a Logs Service to learn more. The collected logs and metrics data is stored in such a seperate dedicated instance. This ensures data isolation and no single point of failures.
CloudAEye Traces Analyzer supports AWS X-Ray and can automatically detect anomalies. The collected trace data is stored in seperate stores.
Console
User is given access to dashboards for viewing and management of application data and analysis. For an example, refer to View Logs to learn more.
REST APIs
CloudAEye SaaS uses the API-first approach with a micro-services architecture. All services are backed by REST APIs. All clients (ex. Console, CLI) communicates over the REST APIs.
Command-Line Interface (CLI)
CloudAEye (caeops) is a command-line interface for power users. Refer to CLI Reference Guide to learn more.
Data Pipelines
Data pipeline provides continuous access to logs, metrics and traces to AI/ML models for analysis.
Anomaly Detection
The AI-powered services analyzes logs, metrics and traces data and detects and automatically surfaces anomalous customer services. For an example, refer to View Logs Anomaly to learn more.
Root-cause Analysis
The AI models provides all contextual informaton and root-cause analystis to reduce MTTR (mean time to repair).
AEye Assistant
This provides a conversational generative AI interface to make observability human-readable. One can use natural langueage queries to their observability data. Refer to AEye Assistant for more details.
Alerts
Customer may configure and receive alerts. Refer to Alerts to learn more.
Notications
Out-of-the-box notification delivers email, SMS, Slack, AWS SNS and webhook based alerts when an incident in production is detected. Customer may configure a Notification Channels.
Plugins
CloudAEye developed few plugins/apps to deliver integrations. This include Slack app for delivering notification to Slack, Jira app to deliver productivity improvements for Jira cloud service and GitHub app for delivering historical contextualization related to code change.
Storage
CloudAEye supports tiered storage and policy based management of data aging. User can store data in Hot, UltraWarm and Cold storage and can use a policy to gradually move data and eventually delete it.
Billing
Billing service provides invoices to customer and detailed information and projection of customer billing.
Key Capability
Semantic Observability
CloudAEye observability is designed to be proactive and less noisy. The SaaS services automatically analyze an anomaly and identifies what is not working. The problem is contextualized from all available data (ex. logs, metrics, traces, tickets, code changes, deployments, chats, etc.) and a hypothesis about it is generated. The automated analysis quickly identifies why a customer’s service is broken, annotates the service in a dependency graph and enables the customer to test fixes rapidly.