AWS DynamoDB
Overview
Amazon DynamoDB is a fully managed NoSQL database service that provides fast and predictable performance with seamless scalability.
Enable collection of DynamoDB logs and metrics in cloudaeye to monitor and analysis of the time-series data using state-of-the-art machine learning technologies for monitoring and anomaly detection in distributed cloud application.
Prerequisites
- User must setup a logs service for the same application.
- Logs service must be added to a service group.
Account Access
This step is optional. We strongly recommend that you allow us to retreive info about your services because it will greatly minimize the chances of making a mistake

Configuration for DynamoDB Logs Collection
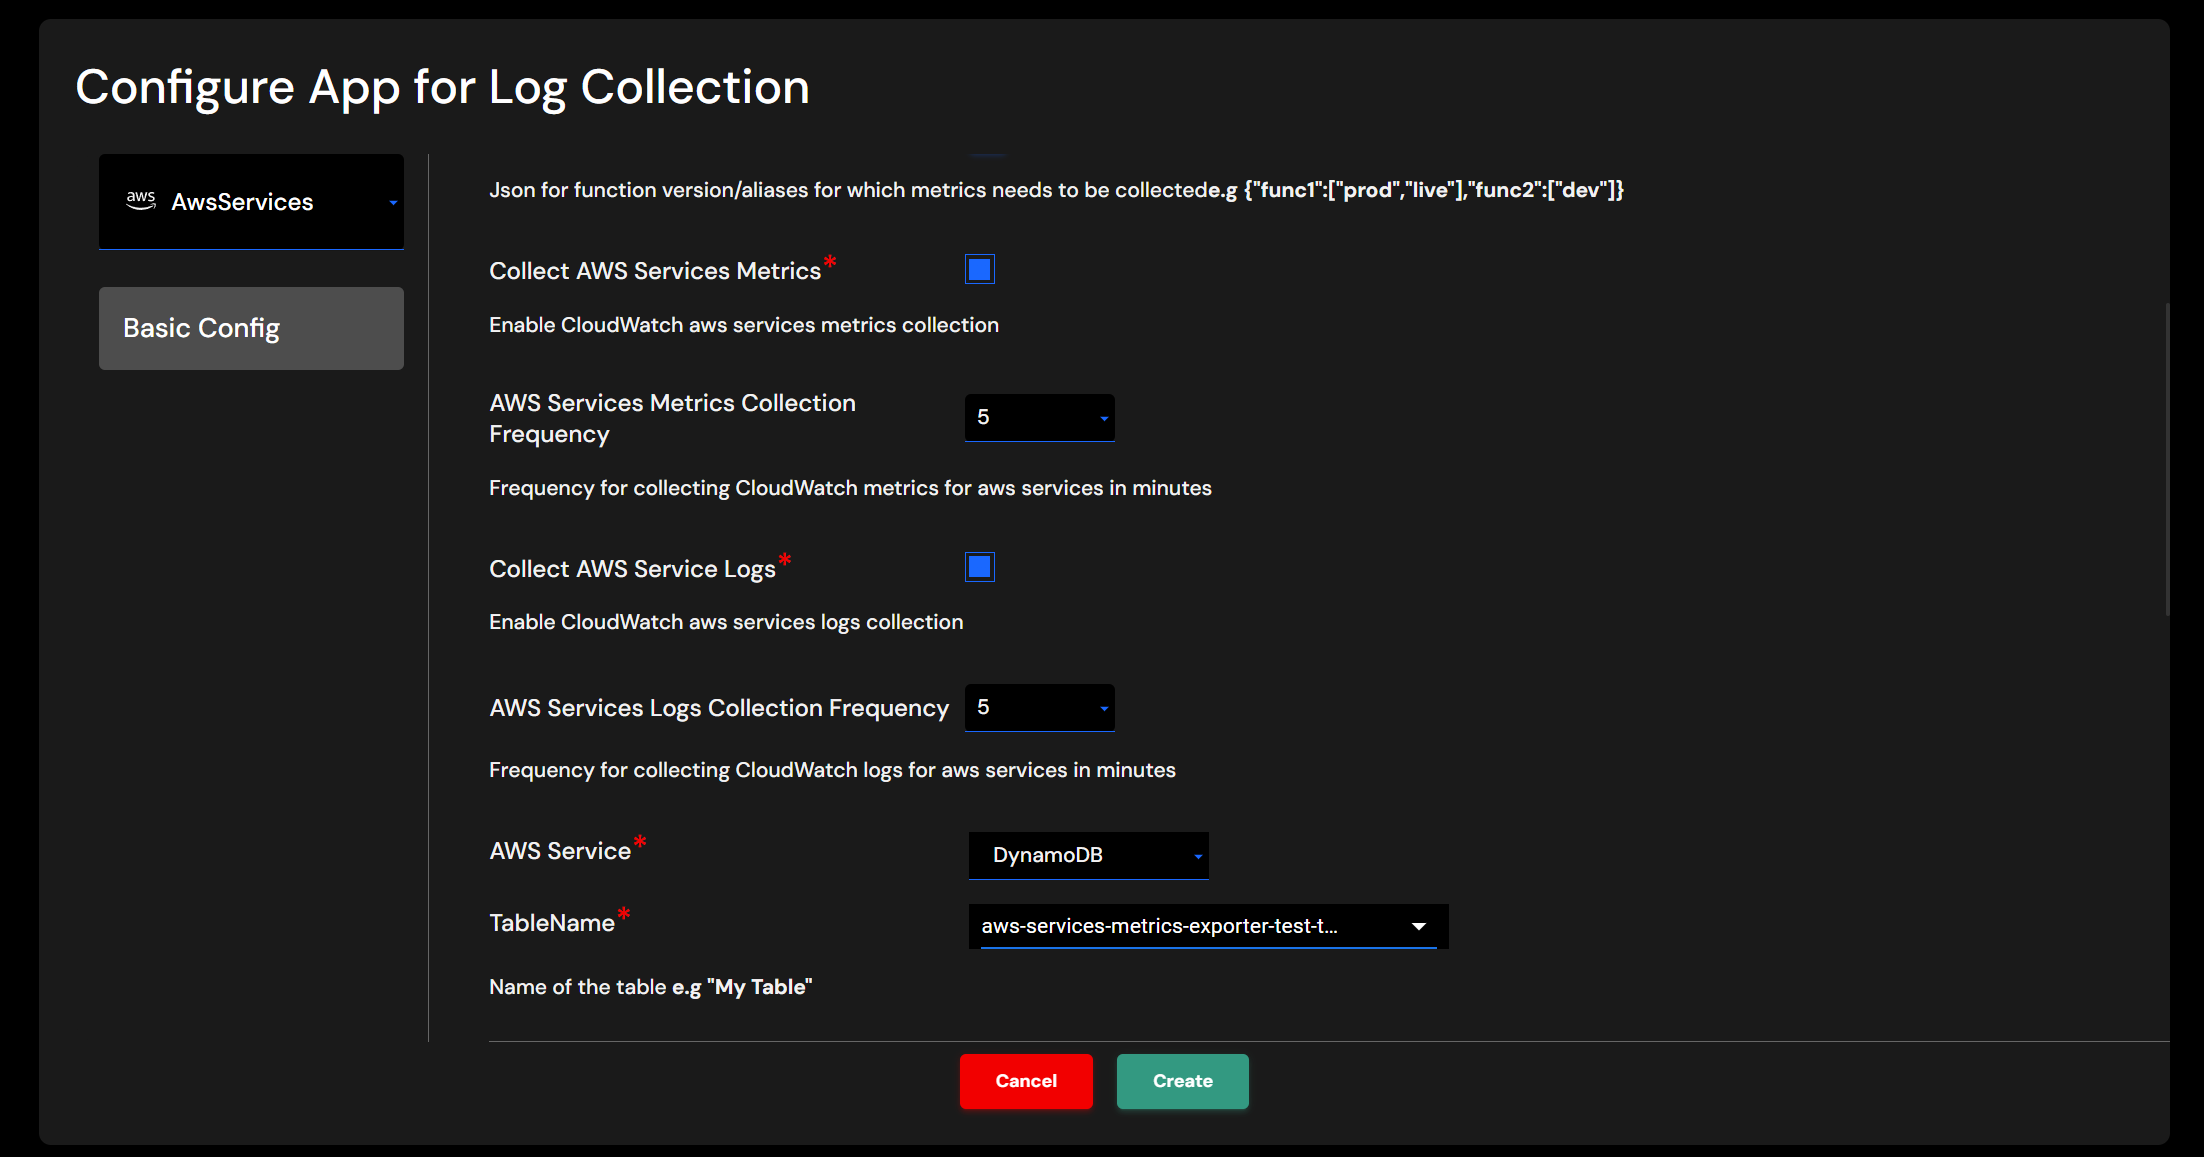
User must select AWS Services field in application creation form and select DynamoDB service from AWS Service dropdown.
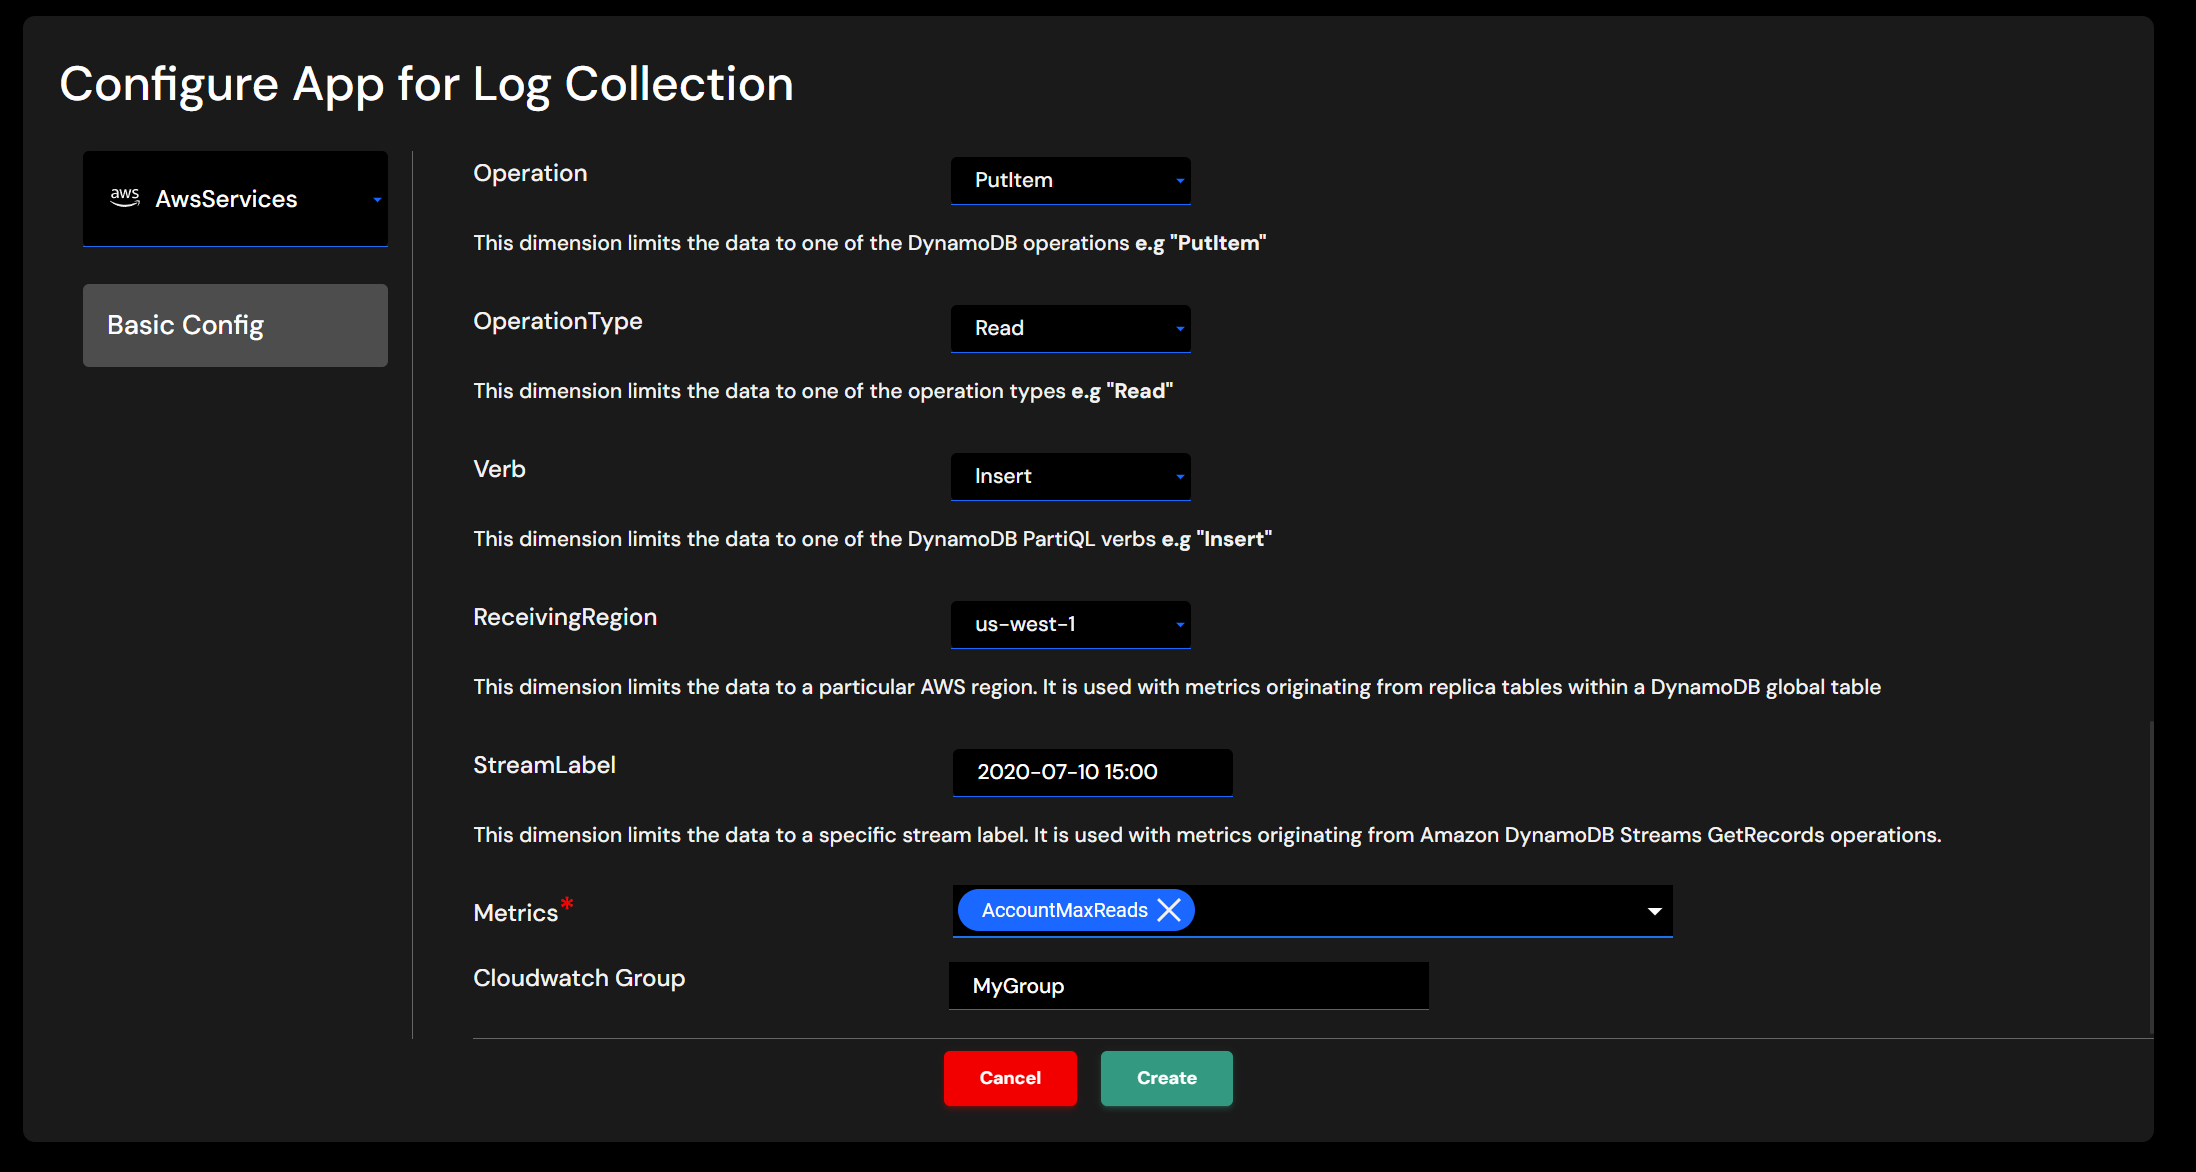
Provide required dimensions and metrics to be collected.
Configuration for DynamoDB Metrics Collection
User must select AWS Services field in application creation form and select DynamoDB service from AWS Service dropdown.
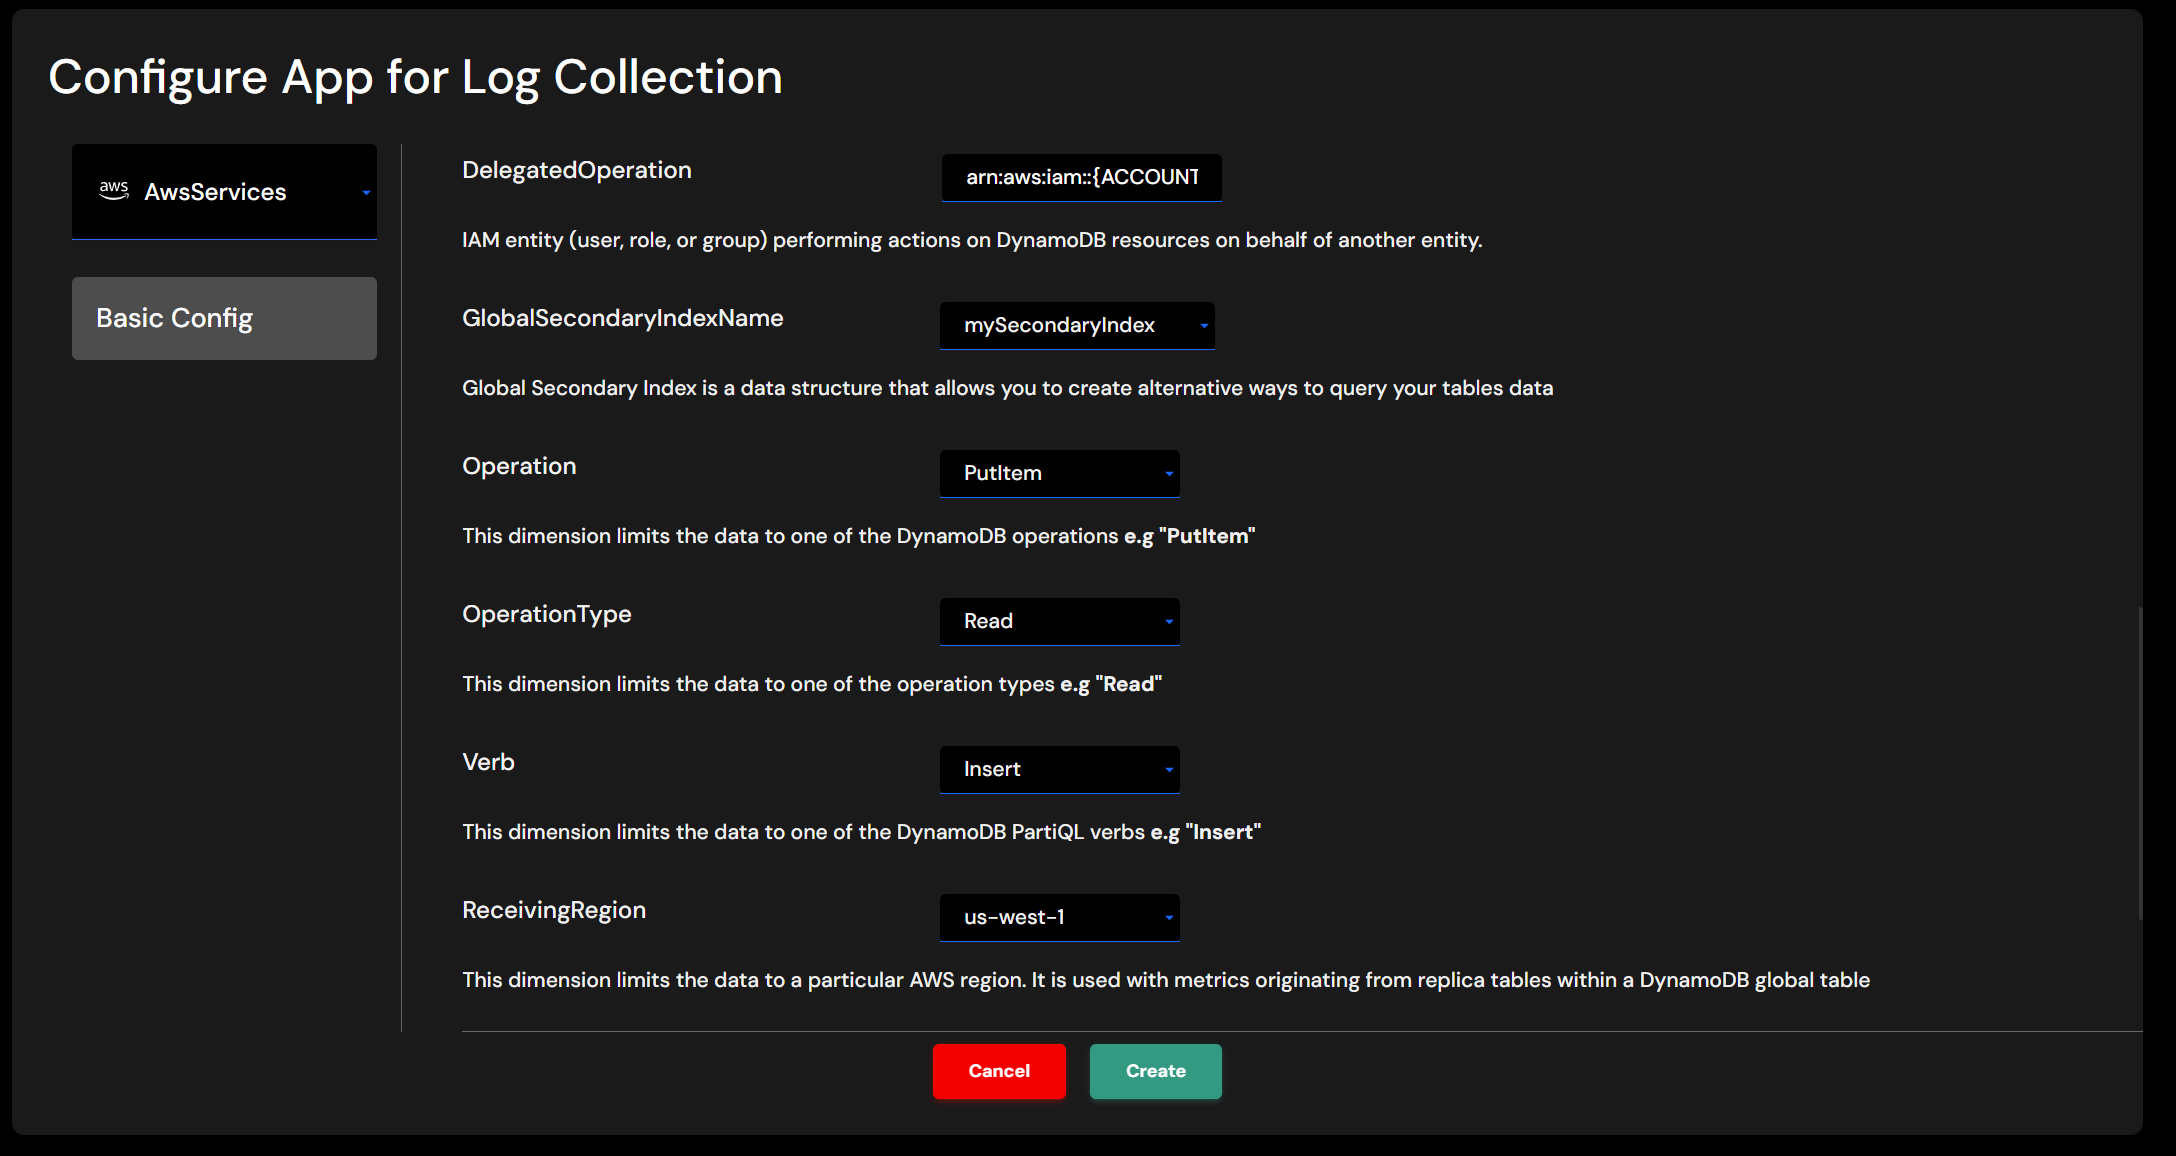
Provide required dimensions and metrics to be collected.
If you have allow us to retreive service details from your account, the dimensions will shown as a dropdown.


Detailed description of metrics and dimension can be viewed at DynamoDB metrics and dimensions
Supported DynamoDB Dimensions
DynamoDB provides below dimensions on which metrics are collected.
| Dimension | Description |
|---|---|
| DelegatedOperation | IAM entity (user, role, or group) performing actions on DynamoDB resources on behalf of another entity |
| GlobalSecondaryIndexName | Global Secondary Index is a data structure that allows you to create alternative ways to query your tables data |
| Operation | This dimension limits the data to one of the DynamoDB operations |
| OperationType | This dimension limits the data to one of the operation types |
| Verb | This dimension limits the data to one of the DynamoDB PartiQL verbs |
| ReceivingRegion | This dimension limits the data to a particular AWS region. It is used with metrics originating from replica tables within a DynamoDB global table |
| StreamLabel | This dimension limits the data to a specific stream label. It is used with metrics originating from Amazon DynamoDB Streams GetRecords operations |
| TableName | Name of the table |
Supported DynamoDB Metrics
DynamoDB provides below metrics to be collected.
| Metrics | Description |
|---|---|
| AccountMaxReads | The maximum number of read capacity units that can be used by an account. This limit does not apply to on-demand tables or global secondary indexes |
| AccountMaxTableLevelReads | The maximum number of read capacity units that can be used by a table or global secondary index of an account. For on-demand tables this limit caps the maximum read request units a table or a global secondary index can use |
| AccountMaxTableLevelWrites | The maximum number of write capacity units that can be used by a table or global secondary index of an account. For on-demand tables this limit caps the maximum write request units a table or a global secondary index can use |
| AccountMaxWrites | The maximum number of write capacity units that can be used by an account. This limit does not apply to on-demand tables or global secondary indexes |
| MaxProvisionedTableReadCapacityUtilization | The percentage of provisioned read capacity utilized by the highest provisioned read table or global secondary index of an account |
| MaxProvisionedTableWriteCapacityUtilization | The percentage of provisioned write capacity utilized by the highest provisioned write table or global secondary index of an account |
| PendingReplicationCount | The number of item updates that are written to one replica table, but that have not yet been written to another replica in the global table |
| TimeToLiveDeletedItemCount | The number of items deleted by Time to Live (TTL) during the specified time period. This metric helps you monitor the rate of TTL deletions on your table |
| ReadThrottleEvents | Requests to DynamoDB that exceed the provisioned read capacity units for a table or a global secondary index |
| SystemErrors | The requests to DynamoDB or Amazon DynamoDB Streams that generate an HTTP 500 status code during the specified time period. An HTTP 500 usually indicates an internal service error |
| ThrottledRequests | Requests to DynamoDB that exceed the provisioned throughput limits on a resource (such as a table or an index) |
| UserErrors | Requests to DynamoDB or Amazon DynamoDB Streams that generate an HTTP 400 status code during the specified time period. An HTTP 400 usually indicates a client-side error, such as an invalid combination of parameters, an attempt to update a nonexistent table, or an incorrect request signature |
| WriteThrottleEvents | Requests to DynamoDB that exceed the provisioned write capacity units for a table or a global secondary index |
| FailedToReplicateRecordCount | The number of records that DynamoDB failed to replicate to your Kinesis data stream |
| ThrottledPutRecordCount | The number of records that were throttled by your Kinesis data stream due to insufficient Kinesis Data Streams capacity |
| ConditionalCheckFailedRequests | The number of failed attempts to perform conditional writes. The PutItem, UpdateItem, and DeleteItem operations let you provide a logical condition that must evaluate to true before the operation can proceed. If this condition evaluates to false, ConditionalCheckFailedRequests is incremented by one. ConditionalCheckFailedRequests is also incremented by one for PartiQL Update and Delete statements where a logical condition is provided and that condition evaluates to false |
| ConsumedReadCapacityUnits | The number of read capacity units consumed over the specified time period for both provisioned and on-demand capacity, so you can track how much of your throughput is used. You can retrieve the total consumed read capacity for a table and all of its global secondary indexes, or for a particular global secondary index |
| ConsumedWriteCapacityUnits | The number of write capacity units consumed over the specified time period for both provisioned and on-demand capacity, so you can track how much of your throughput is used. You can retrieve the total consumed write capacity for a table and all of its global secondary indexes, or for a particular global secondary index |
| OnlineIndexConsumedWriteCapacity | The number of write capacity units consumed when adding a new global secondary index to a table. If the write capacity of the index is too low, incoming write activity during the backfill phase might be throttled. This can increase the time it takes to create the index. You should monitor this statistic while the index is being built to determine whether the write capacity of the index is underprovisioned |
| OnlineIndexPercentageProgress | The percentage of completion when a new global secondary index is being added to a table. DynamoDB must first allocate resources for the new index, and then backfill attributes from the table into the index. For large tables, this process might take a long time |
| OnlineIndexThrottleEvents | The number of write throttle events that occur when adding a new global secondary index to a table. These events indicate that the index creation will take longer to complete, because incoming write activity is exceeding the provisioned write throughput of the index |
| ReturnedBytes | The number of bytes returned by GetRecords operations (Amazon DynamoDB Streams) during the specified time period |
| ReturnedItemCount | The number of items returned by Query, Scan or ExecuteStatement (select) operations during the specified time period |
| ReturnedRecordsCount | The number of stream records returned by GetRecords operations (Amazon DynamoDB Streams) during the specified time period |
| AccountProvisionedReadCapacityUtilization | The percentage of provisioned read capacity units utilized by an account |
| AccountProvisionedWriteCapacityUtilization | The percentage of provisioned write capacity units utilized by an account |
| AgeOfOldestUnreplicatedRecord | The elapsed time since a record yet to be replicated to the Kinesis data stream first appeared in the DynamoDB table |
| ConsumedChangeDataCaptureUnits | The number of consumed change data capture units |
| ProvisionedReadCapacityUnits | The number of provisioned read capacity units for a table or a global secondary index. The TableName dimension returns the ProvisionedReadCapacityUnits for the table, but not for any global secondary indexes. To view ProvisionedReadCapacityUnits for a global secondary index, you must specify both TableName and GlobalSecondaryIndexName |
| ProvisionedWriteCapacityUnits | The number of provisioned write capacity units for a table or a global secondary index. The TableName dimension returns the ProvisionedWriteCapacityUnits for the table, but not for any global secondary indexes. To view ProvisionedWriteCapacityUnits for a global secondary index, you must specify both TableName and GlobalSecondaryIndexName |
| ReplicationLatency | (This metric is for DynamoDB global tables.) The elapsed time between an updated item appearing in the DynamoDB stream for one replica table, and that item appearing in another replica in the global table |
| TransactionConflict | Rejected item-level requests due to transactional conflicts between concurrent requests on the same items |
| SuccessfulRequestLatency | The latency of successful requests to DynamoDB or Amazon DynamoDB Streams during the specified time period |