View Metrics with Grafana
Overview
This topic descries how to use Grafana dashboard(s) to visualize metrics.
Log in
When user tries to access the Grafana dashboard, User will see an OAuth login button. After clicking the OAuth button, user will be redirected to a (Cognito) login page. If the user session is already active, s/he will be automatically logged in into Grafana. Otherwise, s/he will have to enter the (Cognito) credentials. Please note that Grafana and Cognito session will be different. Logging out of one will not logout user from the other service.
View Metrics
Kubernetes Metrics
On the Grafana homepage, user will see a dashboard that shows charts for kubernetes resources.
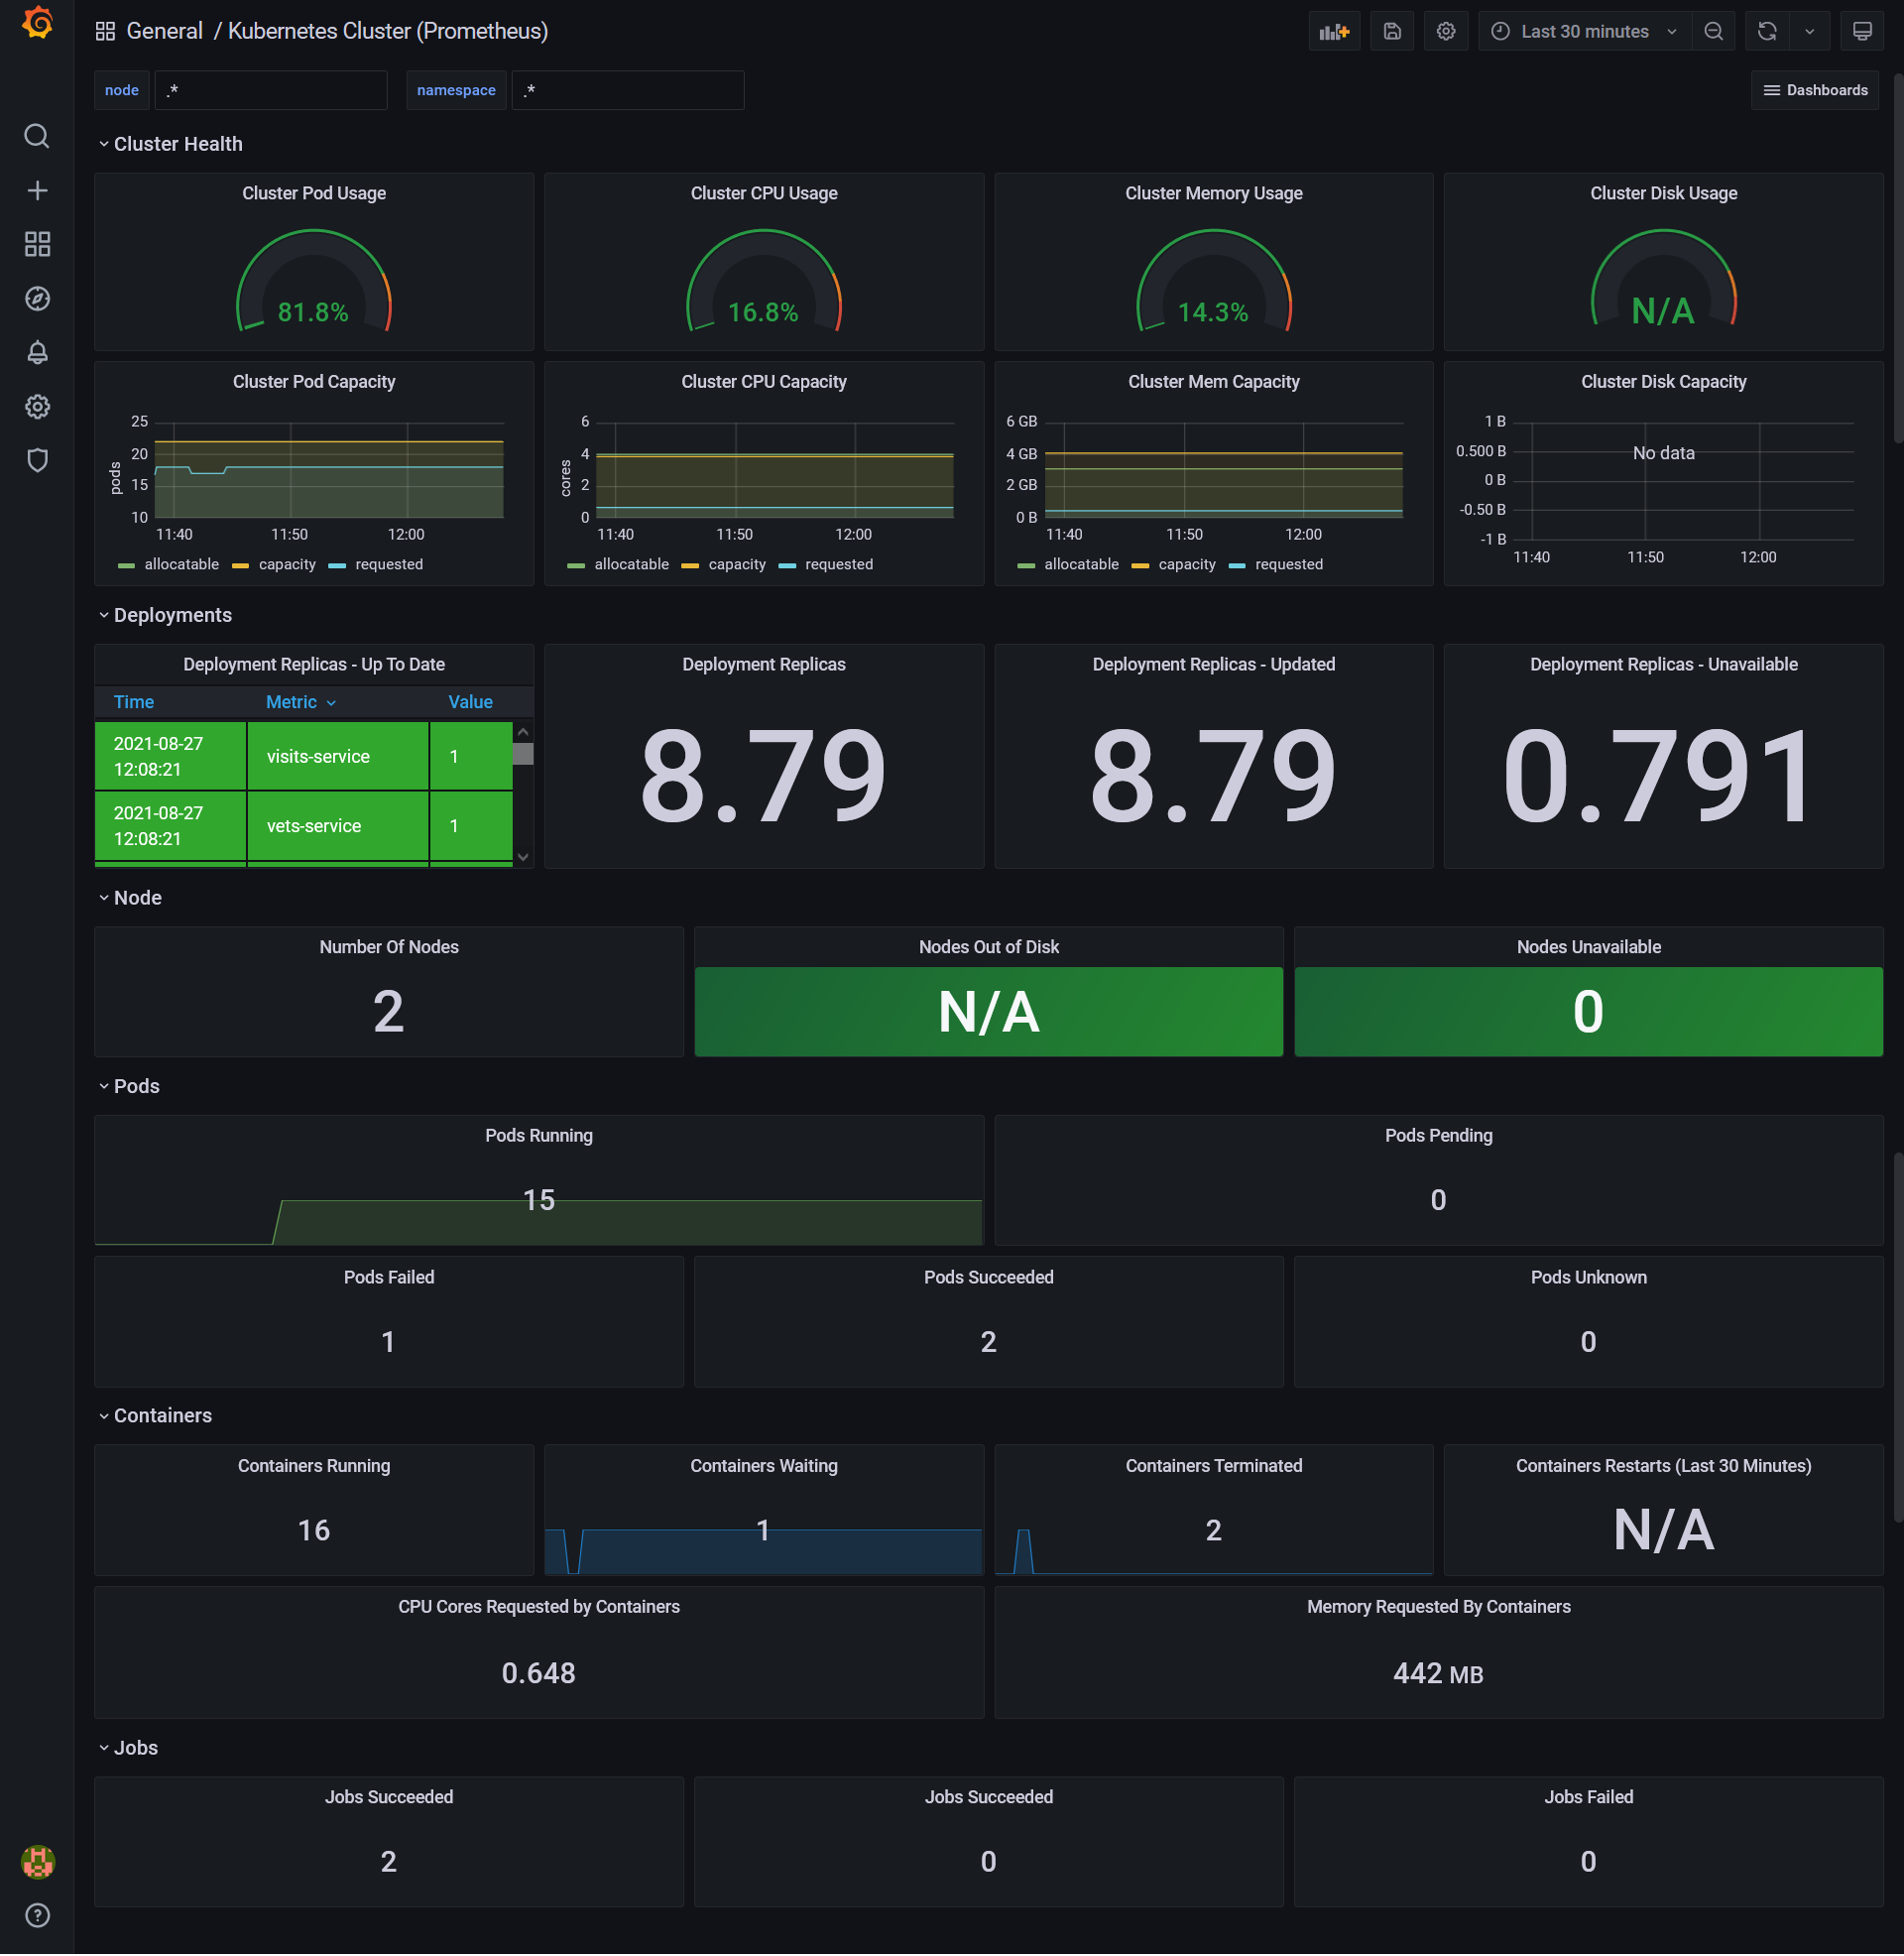
The Kubernetes dashboard shows the following important information about the cluster:
- Cluster Health: Shows cluster pod usage, CPU usage, memory usage and dish usage.
- Deployments: Shows deployment replicas (both updated and unavailable)
- Node Metrics: Number of nodes, nodes out of disk and unavailable
- Pods Metrics: Number of pods running, failed, succeeded, in unknown and in pending status
- Containers Metrics: Number of containers running, in waiting status, terminited, CPU cores requested by containers, memory requested by containers
- Jobs Metrics: Number of jobs succeeded and failed
If user goes to Dashboards → Manager, user will see another dashboard which contains KPIs of applications along with anomalies being detected. This is described View Metrics Anomaly topic.